Updated on November 14th, 2024 by Bob Ciura
Spreadsheet data updated daily
Real estate investment trusts – or REITs, for short – can be fantastic securities for generating meaningful portfolio income. REITs widely offer higher dividend yields than the average stock.
While the S&P 500 Index on average yields less than 2% right now, it is relatively easy to find REITs with dividend yields of 5% or higher.
The following downloadable REIT list contains a comprehensive list of U.S. Real Estate Investment Trusts, along with metrics that matter including:
- Stock price
- Dividend yield
- Market capitalization
- 5-year beta
You can download your free 200+ REIT list (along with important financial metrics like dividend yields and payout ratios) by clicking on the link below:
In addition to the downloadable Excel sheet of all REITs, this article discusses why income investors should pay particularly close attention to this asset class.
And, we also include our top 7 REITs today based on expected total returns.
Table Of Contents
In addition to the full downloadable Excel spreadsheet, this article covers our top 7 REITs today, as ranked using expected total returns from The Sure Analysis Research Database.
The table of contents below allows for easy navigation.
- How To Use The REIT List
- Why Invest In REITs?
- REIT Financial Metrics
- The Top 7 REITs Today
#7: Plymouth Industrial REIT (PLYM)
#6: Alexandria Real Estate Equities (ARE)
#5: Rexford Industrial Realty (REXR)
#4: Brandywine Realty Trust (BDN)
#3: Global Net Lease (GNL)
#2: Community Healthcare Trust (CHCT)
#1: Ellington Credit Co. (EARN)
How To Use The REIT List To Find Dividend Stock Ideas
REITs give investors the ability to experience the economic benefits associated with real estate ownership without the hassle of being a landlord in the traditional sense.
Because of the monthly rental cash flows generated by REITs, these securities are well-suited to investors that aim to generate income from their investment portfolios. Accordingly, dividend yield will be the primary metric of interest for many REIT investors.
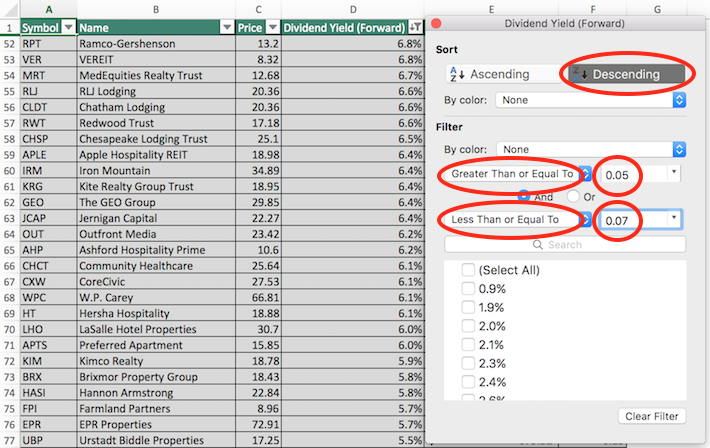
For those unfamiliar with Microsoft Excel, the following images show how to filter for high dividend REITs with dividend yields between 5% and 7% using the ‘filter’ function of Excel.
Step 1: Download the Complete REIT Excel Spreadsheet List at the link above.
Step 2: Click on the filter icon at the top of the ‘Dividend Yield’ column in the Complete REIT Excel Spreadsheet List.
Step 3: Use the filter functions ‘Greater Than or Equal To’ and ‘Less Than or Equal To’ along with the numbers 0.05 ad 0.07 to display REITs with dividend yields between 5% and 7%.
This will help to eliminate any REITs with exceptionally high (and perhaps unsustainable) dividend yields.
Also, click on ‘Descending’ at the top of the filter window to list the REITs with the highest dividend yields at the top of the spreadsheet.
Now that you have the tools to identify high-quality REITs, the next section will show some of the benefits of owning this asset class in a diversified investment portfolio.
Why Invest in REITs?
REITs are, by design, a fantastic asset class for investors looking to generate income.
Thus, one of the primary benefits of investing in these securities is their high dividend yields.
The currently high dividend yields of REITs is not an isolated occurrence. In fact, this asset class has traded at a higher dividend yield than the S&P 500 for decades.
Related: Dividend investing versus real estate investing.
The high dividend yields of REITs are due to the regulatory implications of doing business as a real estate investment trust.
In exchange for listing as a REIT, these trusts must pay out at least 90% of their net income as dividend payments to their unitholders (REITs trade as units, not shares).
Sometimes you will see a payout ratio of less than 90% for a REIT, and that is likely because they are using funds from operations, not net income, in the denominator for REIT payout ratios (more on that later).
REIT Financial Metrics
REITs run unique business models. More than the vast majority of other business types, they are primarily involved in the ownership of long-lived assets.
From an accounting perspective, this means that REITs incur significant non-cash depreciation and amortization expenses.
How does this affect the bottom line of REITs?
Depreciation and amortization expenses reduce a company’s net income, which means that sometimes a REIT’s dividend will be higher than its net income, even though its dividends are safe based on cash flow.
Related: How To Value REITs
To give a better sense of financial performance and dividend safety, REITs eventually developed the financial metric funds from operations, or FFO.
Just like earnings, FFO can be reported on a per-unit basis, giving FFO/unit – the rough equivalent of earnings-per-share for a REIT.
FFO is determined by taking net income and adding back various non-cash charges that are seen to artificially impair a REIT’s perceived ability to pay its dividend.
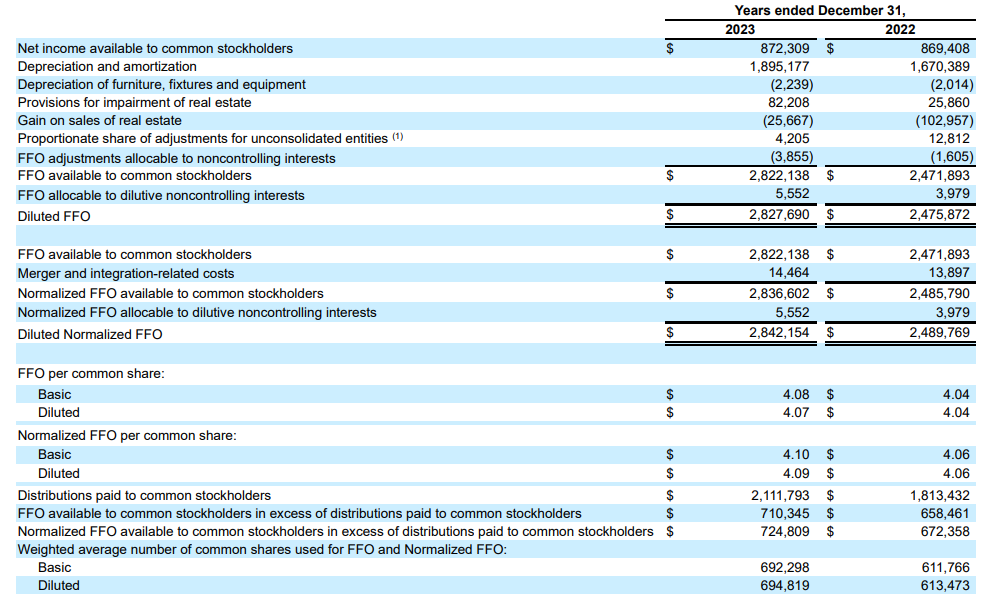
For an example of how FFO is calculated, consider the following net income-to-FFO reconciliation from Realty Income (O), one of the largest and most popular REIT securities.
Source: Realty Income Annual Report
In 2023, net income was $872 million while FFO available to stockholders was above $2.8 billion, a sizable difference between the two metrics.
This shows the profound effect that depreciation and amortization can have on the GAAP financial performance of real estate investment trusts.
The Top 7 REITs Today
Below we have ranked our top 7 REITs today based on expected total returns.
Expected total returns are in turn made up from dividend yield, expected growth on a per unit basis, and valuation multiple changes. Expected total return investing takes into account income (dividend yield), growth, and value.
Note: The REITs below have not been vetted for safety. These are high expected total return securities, but they may come with elevated risks.
We encourage investors to fully consider the risk/reward profile of these investments.
For the Top 10 REITs each month with 4%+ dividend yields, based on expected total returns and safety, see our Top 10 REITs service.
Top REIT #7: Alexandria Real Estate Equities Inc. (ARE)
- Expected Total Return: 15.5%
- Dividend Yield: 4.8%
Alexandria Real Estate Equities owns and operates life science, technology and ag-tech campuses across North America.
Key locations for this Real Estate Investment Trust (REIT) include Boston, San Francisco, New York, San Diego, Seattle, Maryland, and the Research Triangle (North Carolina). The company focuses on high quality properties in prime locations.
Alexandria’s business model has taken on renewed importance as a result of the COVID-19 pandemic, as a significant number of the company’s life science tenants are working on solutions for similar future crises.
On June 3rd, 2024, Alexandria increased its quarterly dividend by 2.4% to $1.30.
On July 22nd, 2024, Alexandria reported second quarter 2024 results for the period ending June 30th, 2024. For the quarter, the company generated $767 million in revenue, a 7.4% increase compared to Q2 2023.
Adjusted funds from operations (FFO) totaled $406 million or $2.36 per share compared to $382 million or $2.24 per share in Q2 2023.
Alexandria ended the quarter with $5.6 billion in liquidity. And more than fifty percent of the company’s tenants are investment-grade or publicly traded large cap businesses.
Click here to download our most recent Sure Analysis report on ARE (preview of page 1 of 3 shown below):
Top REIT #6: Plymouth Industrial REIT (PLYM)
- Expected Total Return: 14.3%
- Dividend Yield: 4.9%
Plymouth Industrial REIT is a full-service, vertically integrated real estate investment trust which acquires, owns, and manages single and multi-tenant industrial properties, which include distribution centers, warehouses, light industrial and small bay industrial properties.
The majority of the property portfolio is located in Florida, Ohio, Indiana, Tennessee, Illinois, and Georgia. As of June 30, 2024, the trust owned and managed 210 buildings, totaling 33.8 million square feet in over 10 markets.
Plymouth’s property portfolio resides almost entirely within The Golden Triangle states, which is within a day’s drive to 70% of the U.S. population, and contains more ports than any other region in the country.
On February 21st, 2024, Plymouth Industrial announced a quarterly dividend of $0.24 per share, a 6.7% increase.
Plymouth Industrial reported third quarter 2024 results on July 31st, 2024. The trust reported core funds from operations (FFO) of $0.48 per common share, up two cents compared to last year. Adjusted FFO per share of $0.49 was a 17% increase compared to Q2 2023. Same store net operating income (NOI) on a cash basis rose by 9.7% year-over-year when excluding early termination income.
Subsequent to the quarter-end, on July 18th, 2024, Plymouth acquired a 1.6M square foot portfolio of industrial properties across Memphis, Tennessee. It paid $100.5 million for a portfolio of 14 buildings that are 94% leased to 46 tenants.
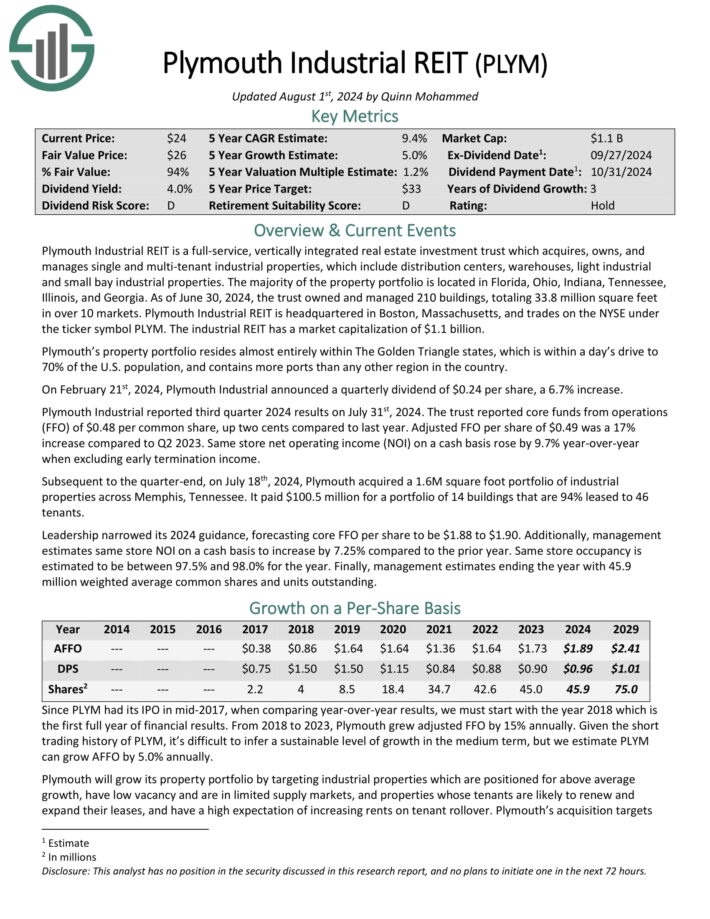
Click here to download our most recent Sure Analysis report on PLYM (preview of page 1 of 3 shown below):
Top REIT #5: Rexford Industrial Realty (REXR)
- Expected Total Return: 15.7%
- Dividend Yield: 4.0%
Rexford Industrial Realty owns and redevelops industrial properties throughout infill Southern California. The REIT was founded in 2001, became public in 2014 and currently has 424 properties with a total rentable area of 50 million square feet.
Rexford Industrial enjoys strong business tailwinds thanks to its exclusive focus on infill Southern California, which is the fourth largest industrial market in the world and the largest industrial market in the U.S.
Source: Investor Presentation
This region has a GDP of $1.8 trillion, the 11th largest in the world, and is characterized by an extremely low vacancy rate of less than 3.0%, markedly high demand and low supply of new properties.
In mid-October, Rexford Industrial reported (10/16/24) financial results for the third quarter of fiscal 2024. Same property net operating income grew 2.6% over the prior year’s quarter, primarily thanks to strong growth in rental rates.
Core funds from operations (FFO) per share grew 5%, from $0.56 to $0.59, in line with the analysts’ consensus. Rexford Industrial has not missed the analysts’ FFO estimates for 23 consecutive quarters.
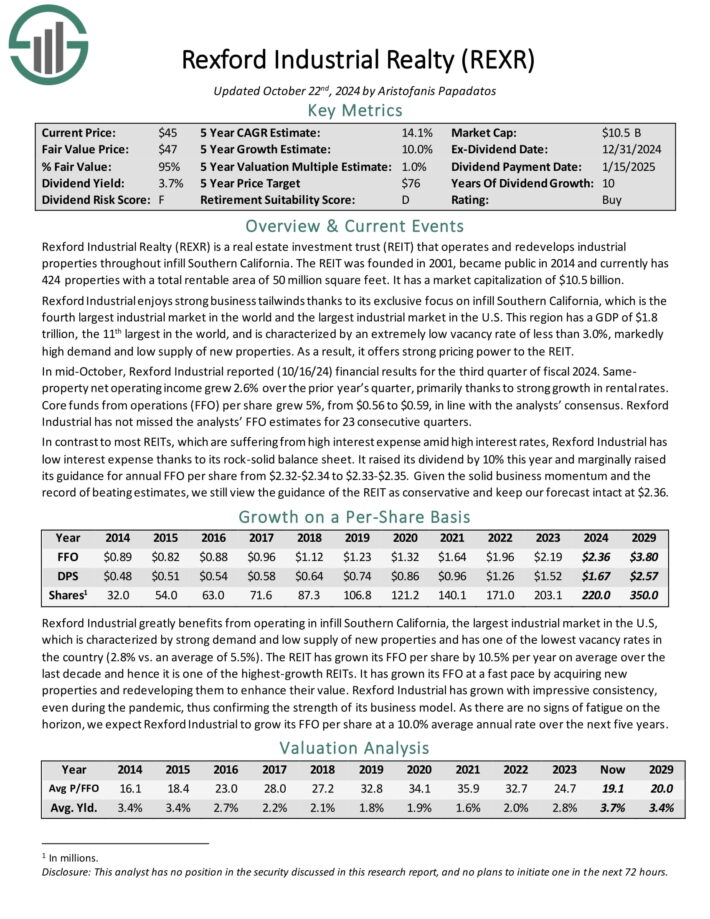
Click here to download our most recent Sure Analysis report on REXR (preview of page 1 of 3 shown below):
Top REIT #4: Global Net Lease (GNL)
- Expected Total Return: 16.1%
- Dividend Yield: 11.5%
Global Net Lease invests in commercial properties in the U.S. and Europe with an emphasis on sale-leaseback transactions. GNL’s portfolio includes over 1300 properties, spanning nearly 67 million square feet with a gross asset value of $9.2 billion.
On August 6, 2024, Global Net Lease reported its financial results for the second quarter of 2024. The company recorded a net loss per share of $0.20, missing expectations by $0.05. Revenue for the quarter was $203.29 million, which, despite representing a significant 112.10% year-over-year increase, missed estimates by $2.06 million.
During the quarter, GNL increased its Adjusted Funds from Operations (AFFO) per share by 2% to $0.33, while reducing its outstanding debt by $251 million. This debt reduction improved the company’s Net Debt to Adjusted EBITDA ratio from 8.4x to 8.1x.
Click here to download our most recent Sure Analysis report on Global Net Lease (GNL) (preview of page 1 of 3 shown below):
Top REIT #2: Community Healthcare Trust (CHCT)
- Expected Total Return: 17.6%
- Dividend Yield: 9.8%
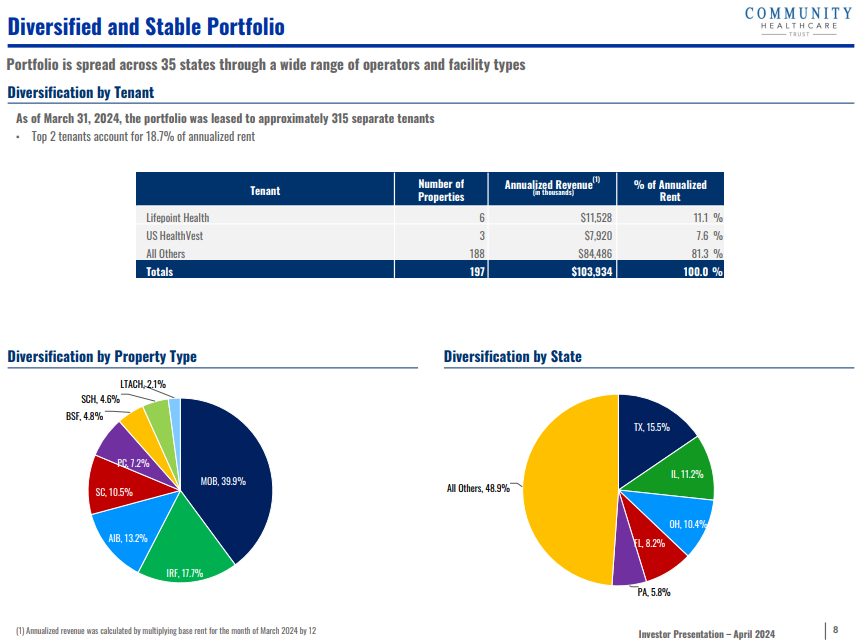
Community Healthcare Trust is an REIT which owns income-producing real estate properties linked to the healthcare sector, such as physician offices, specialty centers, behavioral facilities, inpatient rehabilitation facilities, and medical office buildings.
The trust has investments in 197 properties in 35 states, totaling 4.4 million square feet.
Source: Investor Presentation
On October 29th, 2024, Community Healthcare Trust reported third quarter results for the period ending September 30th, 2024.
Funds from operations (FFO) per share dipped 17% to $0.48 from $0.58 in the prior year quarter. Adjusted FFO per share, however, declined by 13% to $0.55.
During the quarter, Community Healthcare acquired one physician clinic for $6.2 million. The property was 100% leased with a lease expiration in 2027.
The trust also has eleven properties under definitive purchase agreements, with a combined purchase price of roughly $178.3 million, expected to close from 2024 through 2027.
Click here to download our most recent Sure Analysis report on CHCT (preview of page 1 of 3 shown below):
Top REIT #1: Ellington Credit Co. (EARN)
- Expected Total Return: 18.1%
- Dividend Yield: 15.1%
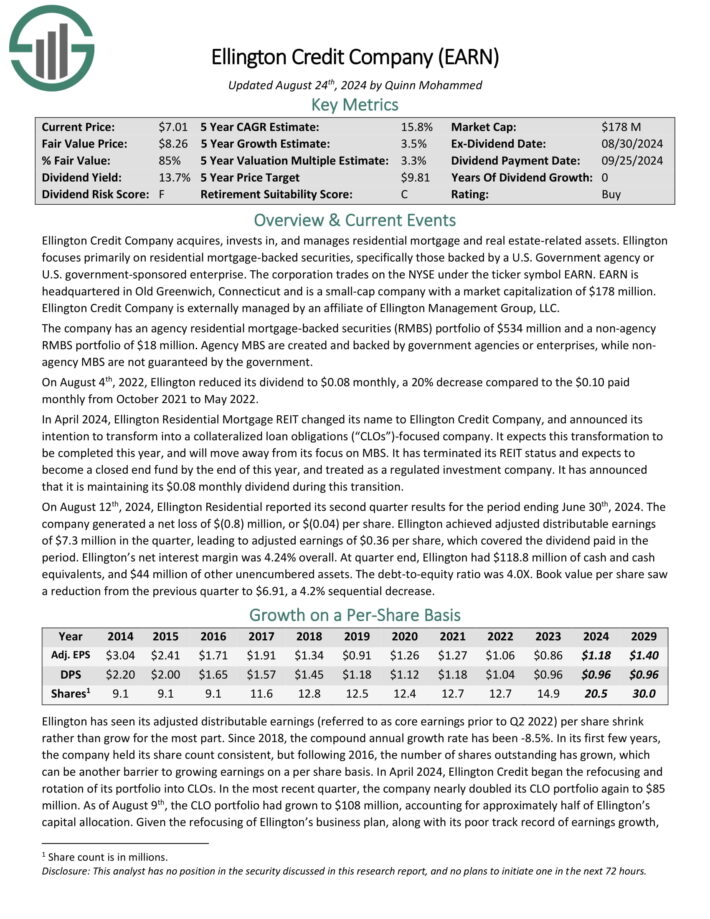
Ellington Credit Co. acquires, invests in, and manages residential mortgage and real estate related assets. Ellington focuses primarily on residential mortgage-backed securities, specifically those backed by a U.S. Government agency or U.S. government–sponsored enterprise.
Agency MBS are created and backed by government agencies or enterprises, while non-agency MBS are not guaranteed by the government.
On August 12th, 2024, Ellington Residential reported its second quarter results for the period ending June 30th, 2024. The company generated a net loss of $(0.8) million, or $(0.04) per share.
Ellington achieved adjusted distributable earnings of $7.3 million in the quarter, leading to adjusted earnings of $0.36 per share, which covered the dividend paid in the period.
Ellington’s net interest margin was 4.24% overall. At quarter end, Ellington had $118.8 million of cash and cash equivalents, and $44 million of other unencumbered assets.
Click here to download our most recent Sure Analysis report on EARN (preview of page 1 of 3 shown below):
Final Thoughts
The REIT Spreadsheet list in this article contains a list of publicly-traded Real Estate Investment Trusts.
However, this database is certainly not the only place to find high-quality dividend stocks trading at fair or better prices.
In fact, one of the best methods to find high-quality dividend stocks is looking for stocks with long histories of steadily rising dividend payments.
Companies that have increased their payouts through many market cycles are highly likely to continue doing so for a long time to come.
You can see more high-quality dividend stocks in the following Sure Dividend databases, each based on long streaks of steadily rising dividend payments:
- Dividend Kings List: Dividend Stocks With 50+ Years of Rising Dividends
- Dividend Aristocrats List: 25+ Years of Rising Dividends
You might also be looking to create a highly customized dividend income stream to pay for life’s expenses.
The following lists provide useful information on high dividend stocks and stocks that pay monthly dividends:


