Updated on February 6th, 2025 by Felix Martinez
Only companies in the S&P 500 Index, with at least 25 years of dividend growth, can claim the title of being a Dividend Aristocrat. This club is so exclusive that there are only 69 such companies in the S&P 500 Index.
As a result, Dividend Aristocrats are relatively rare among the broader S&P 500.
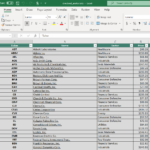
With this in mind, we created a list of all 69 Dividend Aristocrats, along with important financial metrics like price-to-earnings ratios and dividend yields.
You can download an Excel spreadsheet with the full list of Dividend Aristocrats by clicking on the link below:
Disclaimer: Sure Dividend is not affiliated with S&P Global in any way. S&P Global owns and maintains The Dividend Aristocrats Index. The information in this article and downloadable spreadsheet is based on Sure Dividend’s own review, summary, and analysis of the S&P 500 Dividend Aristocrats ETF (NOBL) and other sources, and is meant to help individual investors better understand this ETF and the index upon which it is based. None of the information in this article or spreadsheet is official data from S&P Global. Consult S&P Global for official information.
Chubb Ltd. (CB) has increased its dividend for 32 consecutive years. Chubb yields 1.3% right now, which is not a high dividend yield. It is inline with the S&P 500 Index’s current dividend yield of 1.3%.
While Chubb is not a high-yield dividend stock, it does provide consistent dividend increases each year, backed by a strong business model.
Business Overview
Chubb is based in Zurich, Switzerland, and provides insurance services, including property & casualty insurance, accident & health insurance, life insurance, and reinsurance.
The company operates in over 50 countries and territories. It is the world’s largest publicly traded P&C insurance company and the largest commercial insurer in the U.S.
Chubb has a large and diversified product portfolio.

Source: Investor Presentation
Chubb Ltd reported strong financial results for the fourth quarter and full year of 2024. Quarterly net income was $2.58 billion ($6.33 per share), while core operating income reached $2.45 billion ($6.02 per share). Global property and casualty (P&C) net premiums written grew 6.7%, with commercial and consumer insurance segments increasing 6.4% and 7.5%, respectively. The company achieved a record P&C underwriting income of $1.58 billion, with a combined ratio of 85.7%. Life insurance net premiums grew 8.5%, contributing to segment income of $270 million. Investment income also reached record levels, with pre-tax net investment income of $1.56 billion, up 14.0%.
For the full year, Chubb reported a record net income of $9.27 billion ($22.70 per share) and a core operating income of $9.20 billion ($22.51 per share). Global P&C net premiums increased 9.6%, with North America up 8.0% and Overseas General growing 11.8% in constant dollars. The P&C combined ratio stood at 86.6%, reflecting underwriting income of $5.85 billion. Life insurance premiums grew 15.7%, reaching $6.33 billion, while investment income surged 20.1% to $5.93 billion. The company’s return on equity (ROE) was 15.0%, with a core operating ROE of 13.9%. Chubb also returned $3.48 billion to shareholders through share repurchases and dividends.
Chubb demonstrated robust growth and profitability despite foreign currency losses and catastrophe-related expenses. The company remains optimistic about 2025, citing favorable market conditions and strong momentum in both P&C and life insurance segments. CEO Evan Greenberg emphasized the company’s commitment to supporting policyholders affected by disasters, including the California wildfires, while maintaining a disciplined approach to underwriting and investment. Looking ahead, Chubb expects continued growth in operating earnings, driven by underwriting strength, investment income, and expanding global market opportunities.
Growth Prospects
Chubb has created significant value for shareholders in terms of growing its book value per share, a key metric for insurance companies. Since 2009 the company’s book value has grown at a compound average growth rate of ~7% per year.
As an insurance company, Chubb has a large pool of accumulated premium income that has not been paid out in claims to customers. This is known as float. Insurers invest premiums as soon as they are collected to earn interest or other income.
Higher interest rates can be a positive catalyst for Chubb’s investment income. Increases in portfolio investment yield will generate more pre-tax net investment income per year.
The company also buys back shares which will help grow earnings. Overall, we estimate Chubb could grow earnings-per-share by 4% annually over the next five years.

Source: Investor Presentation
Competitive Advantages & Recession Performance
Chubb’s competitive advantages are its leading industry position as well as its financial strength. First, Chubb is the world’s largest publicly traded property and casualty insurance company and the largest commercial insurer in the United States. It has a dominant position across its product categories, which helps it to retain customers.
It is also in a strong financial position. Chubb is rated A by Standard & Poor’s and Aa3 by Moody’s, the major U.S. credit rating agencies. Its healthy balance sheet and high credit rating provide the company with financial strength that helps retain clients and invest for growth.
The insurance industry can be cyclical. As the economic strengths, people tend to have more discretionary capital that can be used to add to their insurance policies. If the economy weakens, customers may pull back on their spending. This occurred during the Great Recession for Chubb.
- 2007 earnings-per-share of $8.07
- 2008 earnings-per-share of $7.72 (-4.3% decrease)
- 2009 earnings-per-share of $8.17 (5.8% increase)
- 2010 earnings-per-share of $7.79 (-4.7% decrease)
- 2011 earnings-per-share of $6.96 (-10.7% decrease)
Although Chubb didn’t see quite as severe profit declines as many other financial firms, earnings-per-share did experience some variability. However, Chubb remained highly profitable during the Great Recession, which allowed it to continue raising its dividend even through the steep economic downturn. Chubb also remained highly profitable in 2021, even during the coronavirus pandemic.
While earnings-per-share may fluctuate from year to year, the company’s book value has increased more consistently.
Valuation & Expected Returns
Using Chubb’s most recent share price of ~$265 and expected earnings-per-share of $21.00 per share expected for 2025. As a result, the stock trades for a P/E of 12.6, which is above our fair value P/E of 12.
If shares were to revert to this average value by 2030, investors would see total returns reduced fractionally.
Taking the company’s expected EPS growth rate of 4%, dividend yield of 1.3%, and valuation changes collectively leads to total expected returns of 4.3% per year over the next five years.
Thus, valuation headwinds could outweigh most of the returns to be generated from the company’s EPS growth and dividend.
Final Thoughts
While Chubb is a well-managed and diversified insurance stock with a long history of growing book value, we believe the stock will generate low total returns in the coming years.
This is due to the high valuation of the stock compared to its 10-year average and the low dividend yield due to the rising share price. The stability in a cyclical industry is noteworthy, as is the exceptional dividend growth record, but the current valuation makes us lean toward a hold recommendation.
Additionally, the following Sure Dividend databases contain the most reliable dividend growers in our investment universe:
- The Dividend Contenders List: 10-24 consecutive years of dividend increases.
- The Dividend Challengers List: 5-9 consecutive years of dividend increases.
- The Dividend Champions: Dividend stocks with 25+ years of dividend increases, including those that may not qualify as Dividend Aristocrats.
- The Dividend Achievers: dividend stocks with 10+ years of consecutive dividend increases.
- The Dividend Kings: considered to be the ultimate dividend growth stocks, the Dividend Kings list is comprised of stocks with 50+ years of consecutive dividend increases
If you’re looking for stocks with unique dividend characteristics, consider the following Sure Dividend databases:
- The Complete List of Monthly Dividend Stocks: stocks that pay dividends each month, for 12 payments over the year.
- The Blue Chip Stocks List: this database contains stocks that qualify as either Dividend Achievers, Dividend Aristocrats, or Dividend Kings.