Updated on April 1st, 2025 by Bob Ciura
Spreadsheet data updated daily
The Dividend Kings are the best-of-the-best in dividend longevity.
What is a Dividend King? A stock with 50 or more consecutive years of dividend increases.
The downloadable Dividend Kings Spreadsheet List below contains the following for each stock in the index among other important investing metrics:
- Payout ratio
- Dividend yield
- Price-to-earnings ratio
You can see the full downloadable spreadsheet of all 55 Dividend Kings (along with important financial metrics such as dividend yields, payout ratios, and price-to-earnings ratios) by clicking on the link below:
The Dividend Kings list includes recent additions such as RLI Corp. (RLI), Automatic Data Processing (ADP), Consolidated Edison (ED), and Kenvue (KVUE).
Each Dividend King satisfies the primary requirement to be a Dividend Aristocrat (25 years of consecutive dividend increases) twice over.
Not all Dividend Kings are Dividend Aristocrats.
This unexpected result is because the ‘only’ requirement to be a Dividend Kings is 50+ years of rising dividends.
On the other hand, Dividend Aristocrats must have 25+ years of rising dividends, be a member of the S&P 500 Index, and meet certain minimum size and liquidity requirements.
Table of Contents
- How To Use The Dividend Kings List To Find Dividend Stock Ideas
- The 5 Best Dividend Kings Today
#5: PepsiCo Inc. (PEP)
#4: PPG Industries (PPG)
#3: SJW Group (SJW)
#2: Gorman-Rupp Co. (GRC)
#1: Stepan Co. (SCL) - The Dividend Kings In Focus Series
- Performance Of The Dividend Kings
- Sector & Market Capitalization Overview
- Final Thoughts
How To Use The Dividend Kings List to Find Dividend Stock Ideas
The Dividend Kings list is a great place to find dividend stock ideas. However, not all the stocks in the Dividend Kings list make a great investment at any given time.
Some stocks might be overvalued. Conversely, some might be undervalued – making great long-term holdings for dividend growth investors.
For those unfamiliar with Microsoft Excel, the following walk-through shows how to filter the Dividend Kings list for the stocks with the most attractive valuation based on the price-to-earnings ratio.
Step 1: Download the Dividend Kings Excel Spreadsheet.
Step 2: Follow the steps in the instructional video below. Note that we screen for price-to-earnings ratios of 15 or below in the video. You can choose any threshold that best defines ‘value’ for you.
Alternatively, following the instructions above and filtering for higher dividend yield Dividend Kings (yields of 2% or 3% or higher) will show stocks with 50+ years of rising dividends and above-average dividend yields.
Looking for businesses that have a long history of dividend increases isn’t a perfect way to identify stocks that will increase their dividends every year in the future, but there is considerable consistency in the Dividend Kings.
The 5 Best Dividend Kings Today
The following 5 stocks are our top-ranked Dividend Kings today, based on expected annual returns over the next 5 years. Stocks are ranked in order of lowest to highest expected annual returns.
Total returns include a combination of future earnings-per-share growth, dividends, and any changes in the P/E multiple.
Dividend King #5: PepsiCo Inc. (PEP)
- 5-Year Annual Expected Returns: 15.6%
PepsiCo is a global food and beverage company. Its products include Pepsi, Mountain Dew, Frito-Lay chips, Gatorade, Tropicana orange juice and Quaker foods.
Its business is split roughly 60-40 in terms of food and beverage revenue. It is also balanced geographically between the U.S. and the rest of the world.
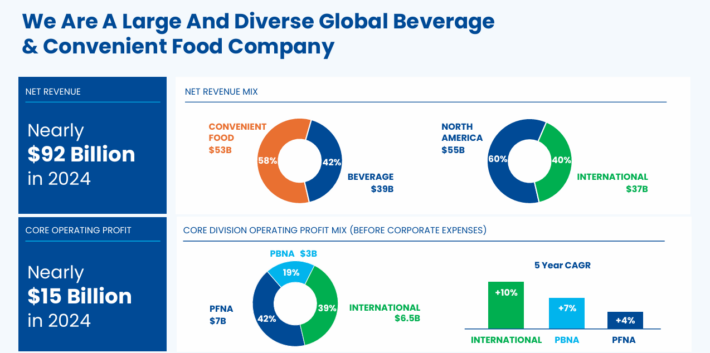
Source: Investor Presentation
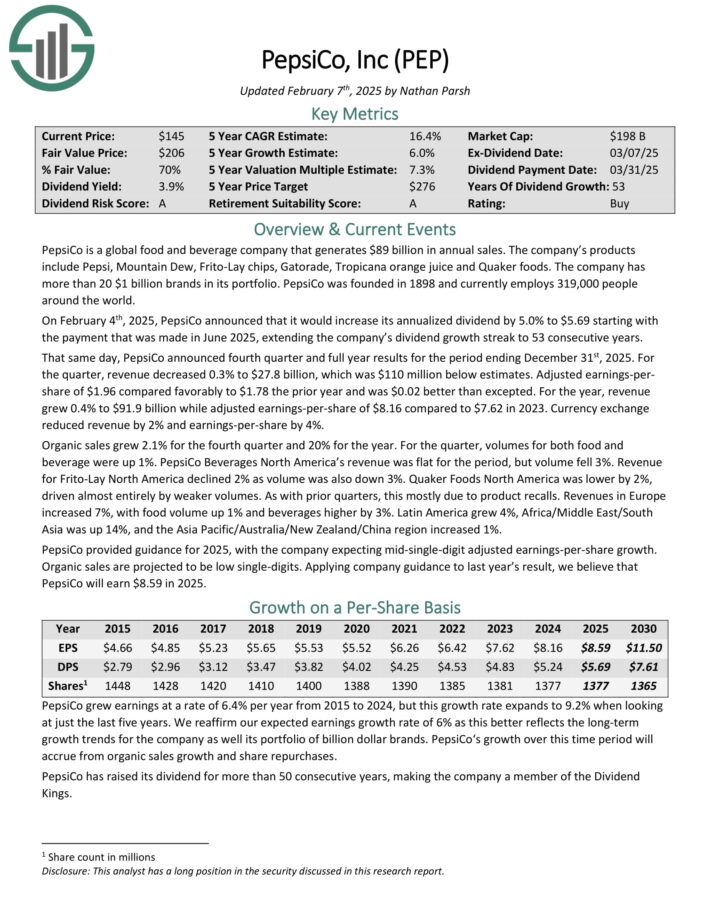
On February 4th, 2025, PepsiCo announced that it would increase its annualized dividend by 5.0% to $5.69 starting with the payment that was made in June 2025, extending the company’s dividend growth streak to 53 consecutive years.
That same day, PepsiCo announced fourth quarter and full year results for the period ending December 31st, 2025. For the quarter, revenue decreased 0.3% to $27.8 billion, which was $110 million below estimates.
Adjusted earnings-per-share of $1.96 compared favorably to $1.78 the prior year and was $0.02 better than excepted.
For the year, revenue grew 0.4% to $91.9 billion while adjusted earnings-per-share of $8.16 compared to $7.62 in 2023. Currency exchange reduced revenue by 2% and earnings-per-share by 4%.
Click here to download our most recent Sure Analysis report on PEP (preview of page 1 of 3 shown below):
Dividend King #4: PPG Industries (PPG)
- 5-Year Annual Expected Returns: 15.7%
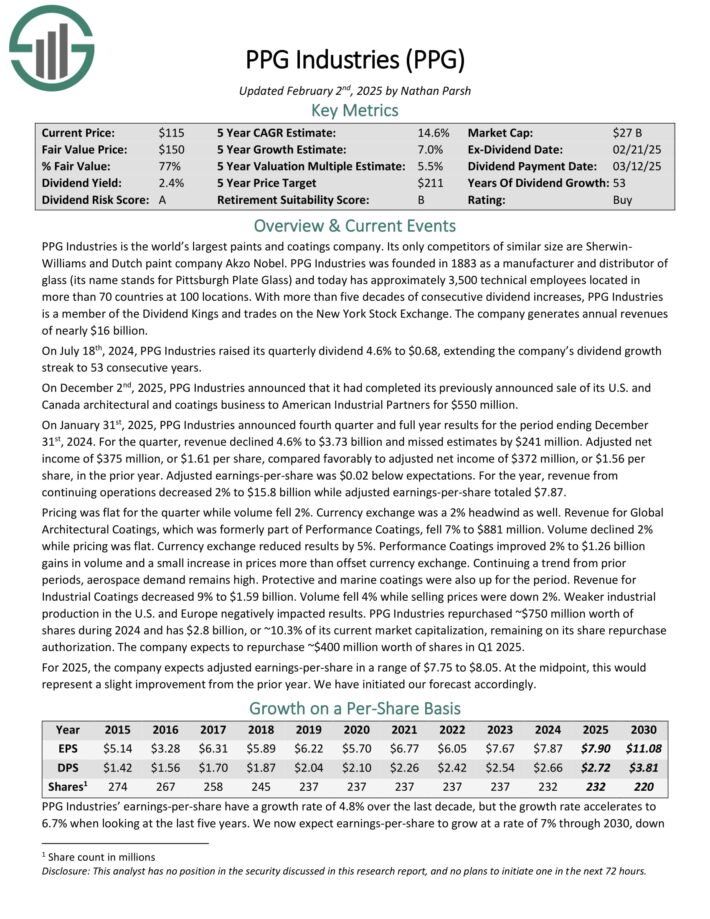
PPG Industries is the world’s largest paints and coatings company. Its only competitors of similar size are Sherwin-Williams and Dutch paint company Akzo Nobel.
PPG Industries was founded in 1883 as a manufacturer and distributor of glass (its name stands for Pittsburgh Plate Glass) and today has approximately 3,500 technical employees located in more than 70 countries at 100 locations.
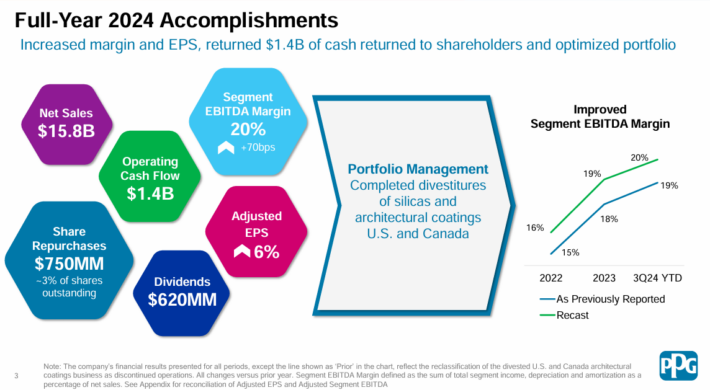
On January 31st, 2025, PPG Industries announced fourth quarter and full year results for the period ending December 31st, 2024. For the quarter, revenue declined 4.6% to $3.73 billion and missed estimates by $241 million.
Adjusted net income of $375 million, or $1.61 per share, compared favorably to adjusted net income of $372 million, or $1.56 per share, in the prior year. Adjusted earnings-per-share was $0.02 below expectations.
Source: Investor Presentation
For the year, revenue from continuing operations decreased 2% to $15.8 billion while adjusted earnings-per-share totaled $7.87.
PPG Industries repurchased ~$750 million worth of shares during 2024 and has $2.8 billion, or ~10.3% of its current market capitalization, remaining on its share repurchase authorization. The company expects to repurchase ~$400 million worth of shares in Q1 2025.
For 2025, the company expects adjusted earnings-per-share in a range of $7.75 to $8.05.
Click here to download our most recent Sure Analysis report on PPG (preview of page 1 of 3 shown below):
Dividend King #3: SJW Group (SJW)
- 5-Year Annual Expected Returns: 17.6%
SJW Group is a water utility company that produces, purchases, stores, purifies and distributes water to consumers and businesses in the Silicon Valley area of California, the area north of San Antonio, Texas, Connecticut, and Maine.
SJW Group has a small real estate division that owns and develops properties for residential and warehouse customers in California and Tennessee. The company generates about $670 million in annual revenues.
On February 27th, 2025, SJW Group announced fourth quarter and full year results for the period ending December 31st, 2024. For the quarter, revenue improved 15.5% to $197.8 million, which topped expectations by $10.3 million.
Earnings-per-share of $0.74 compared favorably to earnings-per-share of $0.59 in the prior year and was $0.19 ahead of estimates. For the year, revenue grew 12% to $748.4 million while earnings-per-share of $2.87 compared to $2.68 in
2023.
For the quarter, higher water rates overall added $22.8 million to results and higher customer usage added $9.9 million while regulatory mechanisms lowered revenue totals by $7.1 million.
Operating production expenses totaled $154.2 million, which was a 14% increase from the prior year.
Click here to download our most recent Sure Analysis report on SJW (preview of page 1 of 3 shown below):

Dividend King #2: Gorman-Rupp Co. (GRC)
- 5-Year Annual Expected Returns: 18.4%
Gorman-Rupp began manufacturing pumps and pumping systems back in 1933. Since that time, it has grown into an industry leader with annual sales of nearly $700 million and a market capitalization of $1 billion.
Today, Gorman-Rupp is a focused, niche manufacturer of critical systems that many industrial clients rely upon for their own success.
Gorman Rupp generates about one-third of its total revenue from outside of the U.S.

Source: Investor Presentation
Gorman-Rupp posted fourth quarter and full-year earnings on February 7th, 2025, and results were weaker than expected. Adjusted earnings-per-share came to 42 cents, which was three cents light of estimates.
Revenue was up 1.3% year-over-year to $162.7 million, which matched expectations. The increase in sales was primarily attributed to the impact of pricing increases taken in the year-ago period.
Gross profit was $49.2 million for the quarter, or 30.2% of revenue. These were down from $50.9 million and 31.7%, respectively, in the same period of 2023.
The decline in gross margins of 150 basis points included 220 basis points of increased labor and overhead costs, which were driven by healthcare expenses.
That was partially offset by a 70-basis point improvement in cost of materials, which itself was driven by a 140-basis point improvement in selling prices offset by a 70-basis point decline from inventory costing.
Click here to download our most recent Sure Analysis report on GRC (preview of page 1 of 3 shown below):

Dividend King #1: Stepan Co. (SCL)
- 5-Year Annual Expected Returns: 21.3%
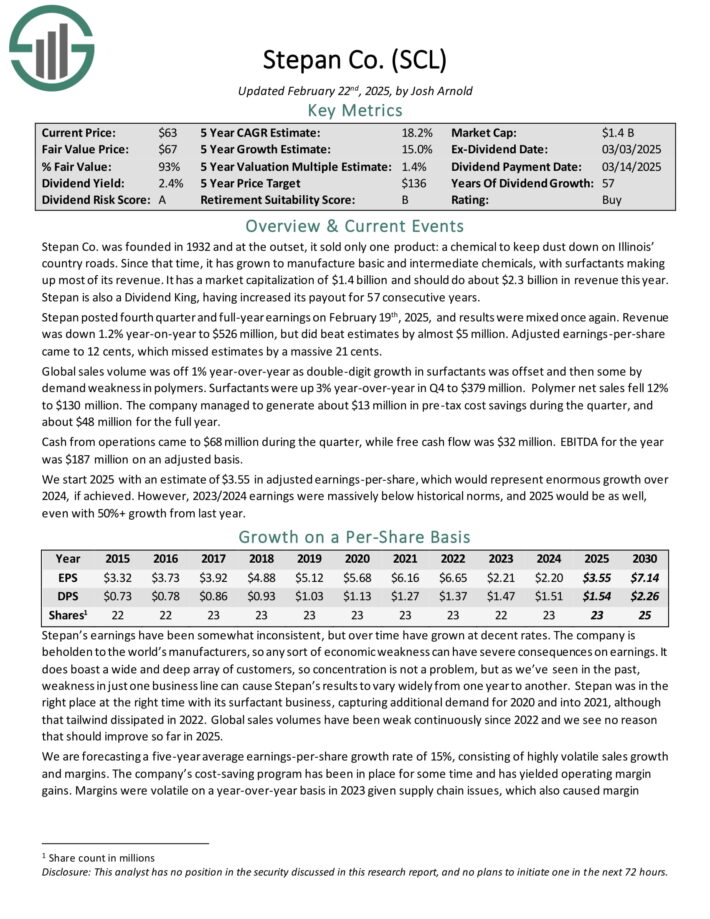
Stepan manufactures basic and intermediate chemicals, including surfactants, specialty products, germicidal and fabric softening quaternaries, phthalic anhydride, polyurethane polyols and special ingredients for the food, supplement, and pharmaceutical markets.
It is organized into three distinct business lines: surfactants, polymers, and specialty products. These businesses serve a wide variety of end markets, meaning that Stepan is not beholden to just a handful of industries.
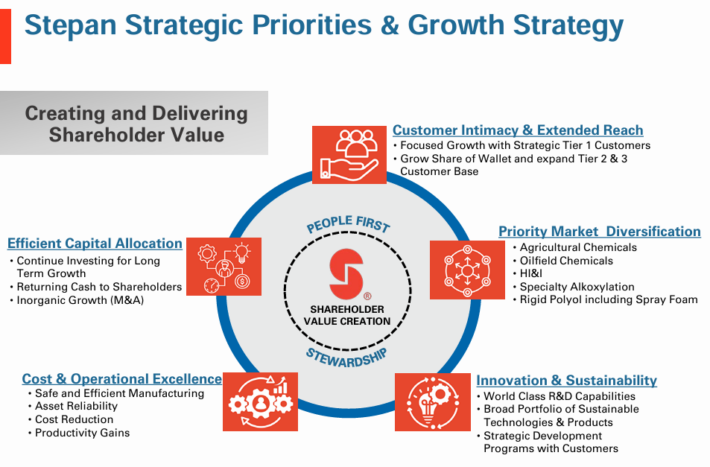
Source: Investor presentation
The surfactants business is Stepan’s largest by revenue, accounting for ~68% of total sales in the most recent quarter. A surfactant is an organic compound that contains both water-soluble and water-insoluble components.
Stepan posted fourth quarter and full-year earnings on February 19th, 2025, and results were mixed once again. Revenue was down 1.2% year-on-year to $526 million, but did beat estimates by almost $5 million. Adjusted earnings-per-share came to 12 cents, which missed estimates by 21 cents.
Global sales volume was off 1% year-over-year as double-digit growth in surfactants was offset and then some by demand weakness in polymers. Surfactants were up 3% year-over-year in Q4 to $379 million. Polymer net sales fell 12% to $130 million.
The company managed to generate about $13 million in pre-tax cost savings during the quarter, and about $48 million for the full year.
Click here to download our most recent Sure Analysis report on SCL (preview of page 1 of 3 shown below):
The Dividend Kings In Focus Series
You can see analysis on every single Dividend King below. The newest Sure Analysis Research Database report for each security is included as well.
Consumer Staples
- Altria Group (MO) | [See newest Sure Analysis report]
- Archer-Daniels-Midland (ADM) | [See newest Sure Analysis report]
- Colgate-Palmolive (CL) | [See newest Sure Analysis report]
- Coca-Cola (KO) | [See newest Sure Analysis report]
- Hormel Foods (HRL) | [See newest Sure Analysis report]
- Kimberly-Clark (KMB) | [See newest Sure Analysis report]
- Lancaster Colony (LANC) | [See newest Sure Analysis report]
- PepsiCo (PEP) | [See newest Sure Analysis report]
- Procter & Gamble (PG) [See newest Sure Analysis report]
- Sysco Corporation (SYY) | [See newest Sure Analysis report]
- Target Corporation (TGT) | [See newest Sure Analysis report]
- Tootsie Roll Industries (TR) | [See newest Sure Analysis report]
- Universal Corporation (UVV) | [See newest Sure Analysis report]
- Walmart (WMT) | [See newest Sure Analysis report]
Industrials
- ABM Industries (ABM) | [See newest Sure Analysis report]
- Automatic Data Processing (ADP) | [See newest Sure Analysis report]
- Dover (DOV) | [See newest Sure Analysis report]
- Emerson Electric (EMR) | [See newest Sure Analysis report]
- Gorman-Rupp Co. (GRC) | [See newest Sure Analysis report]
- Illinois Tool Works (ITW) | [See newest Sure Analysis report]
- MSA Safety (MSA) | [See newest Sure Analysis report]
- Nordson Corporation (NDSN) | [See newest Sure Analysis report]
- Parker-Hannifin (PH) | [See newest Sure Analysis report]
- Stanley Black & Decker (SWK) | [See newest Sure Analysis report]
- Tennant Co. (TNC) | [See newest Sure Analysis report]
- W.W. Grainger (GWW) | [See newest Sure Analysis report]
Health Care
- Abbott Laboratories (ABT) | [See newest Sure Analysis report]
- AbbVie Inc. (ABBV) | [See newest Sure Analysis report]
- Becton, Dickinson & Company (BDX) | [See newest Sure Analysis report]
- Johnson & Johnson (JNJ) | [See newest Sure Analysis report]
- Kenvue Inc. (KVUE) | [See newest Sure Analysis report]
Consumer Discretionary
- Genuine Parts Company (GPC) | [See newest Sure Analysis report]
- Lowe’s Companies (LOW) | [See newest Sure Analysis report]
Financials
- Commerce Bancshares Inc. (CBSH) | [See newest Sure Analysis report]
- Cincinnati Financial (CINF) | [See newest Sure Analysis report]
- Farmers & Merchants Bancorp (FMCB) | [See newest Sure Analysis report]
- RLI Corp. (RLI) | [See newest Sure Analysis report]
- S&P Global (SPGI) | [See newest Sure Analysis report]
- United Bankshares (UBSI) | [See newest Sure Analysis report]
Materials
- H.B. Fuller (FUL) | [See newest Sure Analysis report]
- PPG Industries (PPG) | [See newest Sure Analysis report]
- Nucor (NUE) | [See newest Sure Analysis report]
- RPM International (RPM) | [See newest Sure Analysis report]
- Stepan Co. (SCL) | [See newest Sure Analysis report]
Energy
Real Estate
Utilities
- American States Water (AWR) | [See newest Sure Analysis report]
- Black Hills Corp. (BKH) | [See newest Sure Analysis report]
- California Water Service Group (CWT) | [See newest Sure Analysis report]
- Canadian Utilities (CDUAF) | [See newest Sure Analysis report]
- Consolidated Edison (ED) | [See newest Sure Analysis report]
- Fortis Inc. (FTS) | [See newest Sure Analysis report]
- Middlesex Water Company (MSEX) | [See newest Sure Analysis report]
- Northwest Natural Holding (NWN) | [See newest Sure Analysis report]
- SJW Group (SJW) | [See newest Sure Analysis report]
Performance Of The Dividend Kings
The Dividend Kings out-performed the S&P 500 ETF (SPY) in February 2025. Return data for the month is shown below:
- Dividend Kings February 2025 total return: 0.4%
- SPY February 2025 total return: -1.3%
Stable dividend growers like the Dividend Kings tend to underperform in bull markets and outperform on a relative basis during bear markets.
The Dividend Kings are not officially regulated and monitored by any one company. There’s no Dividend King ETF. This means that tracking the historical performance of the Dividend Kings can be difficult.
More specifically, performance tracking of the Dividend Kings often introduces significant survivorship bias.
Survivorship bias occurs when one looks at only the companies that ‘survived’ the time period in question. In the case of Dividend Kings, this means that the performance study does not include ex-Kings that reduced their dividend, were acquired, etc.
But with that said, there is something to be gained from investigating the historical performance of the Dividend Kings. Specifically, the performance of the Dividend Kings shows that ‘boring’ established blue-chip stocks that increase their dividend year-after-year can significantly outperform over long periods of time.
Notes: S&P 500 performance is measured using the S&P 500 ETF (SPY). The Dividend Kings performance is calculated using an equal weighted portfolio of today’s Dividend Kings, rebalanced annually. Due to insufficient data, Farmers & Merchants Bancorp (FMCB) returns are from 2000 onward. Performance excludes previous Dividend Kings that ended their streak of dividend increases which creates notable lookback/survivorship bias. The data for this study is from Ycharts.
In the next section of this article, we will provide an overview of the sector and market capitalization characteristics of the Dividend Kings.
Sector & Market Capitalization Overview
The sector and market capitalization characteristics of the Dividend Kings are very different from the characteristics of the broader stock market.
The following bullet points show the number of Dividend Kings in each sector of the stock market.
- Consumer Staples: 14
- Industrials: 12
- Utilities: 9
- Consumer Discretionary: 2
- Health Care: 5
- Financials: 6
- Materials: 5
- Real Estate: 1
- Energy: 1
- Communication Services: 0
The Dividend Kings are overweight in the Industrials, Consumer Staples, and Utilities sectors. Interestingly, The Dividend Kings have zero stocks from the Information Technology sector, which is the largest component of the S&P 500 index.
The Dividend Kings also have some interesting characteristics with respect to market capitalization. These trends are illustrated below.
- 6 Mega caps ($200 billion+ market cap; ABBV, JNJ, PEP, PG, KO, WMT)
- 26 Large caps ($10 billion to $200 billion market cap)
- 15 Mid caps ($2 billion to $10 billion)
- 8 Small caps ($300 million to $2 billion)
Interestingly, 24 out of the 55 Dividend Kings have market capitalizations below $10 billion. This shows that corporate longevity doesn’t have to be accompanied by massive size.
Final Thoughts
Screening to find the best Dividend Kings is not the only way to find high-quality dividend growth stock ideas.
Sure Dividend maintains similar databases on the following useful universes of stocks:
- The High Yield Dividend Kings List is comprised of the 20 Dividend Kings with the highest current yields.
- The Dividend Aristocrats: S&P 500 stocks with 25+ years of consecutive dividend increases.
- The Complete List of High Dividend Stocks: Stocks with 5%+ dividend yields.
- The Complete List of Monthly Dividend Stocks: our database currently contains roughly 80 stocks that pay dividends every month.
There is nothing magical about investing in the Dividend Kings. They are simply a group of high-quality businesses with shareholder-friendly management teams that have strong competitive advantages.
Purchasing businesses with these characteristics at fair or better prices and holding them for long periods of time will likely result in strong long-term investment performance.