Article updated on April 1st, 2025 by Bob Ciura
Spreadsheet data updated daily
The Dividend Aristocrats are a select group of 69 S&P 500 stocks with 25+ years of consecutive dividend increases.
They are the ‘best of the best’ dividend growth stocks. The Dividend Aristocrats have a long history of outperforming the market.
The requirements to be a Dividend Aristocrat are:
- Be in the S&P 500
- Have 25+ consecutive years of dividend increases
- Meet certain minimum size & liquidity requirements
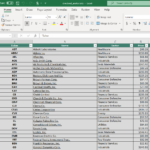
There are currently 69 Dividend Aristocrats. You can download an Excel spreadsheet of all 69 (with metrics that matter such as dividend yields and price-to-earnings ratios) by clicking the link below:
Disclaimer: Sure Dividend is not affiliated with S&P Global in any way. S&P Global owns and maintains The Dividend Aristocrats Index. The information in this article and downloadable spreadsheet is based on Sure Dividend’s own review, summary, and analysis of the S&P 500 Dividend Aristocrats ETF (NOBL) and other sources, and is meant to help individual investors better understand this ETF and the index upon which it is based. None of the information in this article or spreadsheet is official data from S&P Global. Consult S&P Global for official information.
Note 1: On January 24th, 2025, Erie Indemnity (ERIE), Eversource Energy (ES), and FactSet Research System (FDS) were added to the list with no deletions, leaving 69 Dividend Aristocrats.
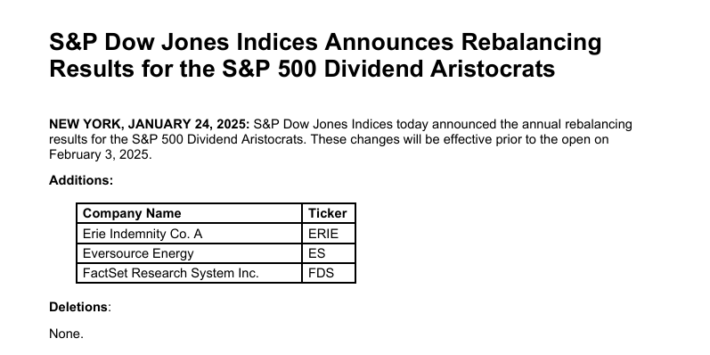
Source: S&P News Releases.
You can see detailed analysis on all 69 further below in this article, in our Dividend Aristocrats In Focus Series. Analysis includes valuation, growth, and competitive advantage(s).
Table of Contents
- How To Use The Dividend Aristocrats List To Find Dividend Investment Ideas
- Performance of the Dividend Aristocrats
- Sector Overview
- The 10 Best Dividend Aristocrats Now
- Dividend Aristocrats Analysis (The Dividend Aristocrats In Focus Series)
- Historical Dividend Aristocrats List (1989 – 2025)
- Frequently Asked Questions
- Final Thoughts
How to Use The Dividend Aristocrats List To Find Dividend Investment Ideas
The downloadable Dividend Aristocrats Excel Spreadsheet List above contains the following for each stock in the index:
- Price-to-earnings ratio
- Dividend yield
- Market capitalization
All Dividend Aristocrats are high-quality businesses based on their long dividend histories. A company cannot pay rising dividends for 25+ years without having a strong and durable competitive advantage.
But not all Dividend Aristocrats make equally good investments today. That’s where the spreadsheet in this article comes into play. You can use the Dividend Aristocrats spreadsheet to quickly find quality dividend investment ideas.
The list of all Dividend Aristocrats is valuable because it gives you a concise list of all S&P 500 stocks with 25+ consecutive years of dividend increases (that also meet certain minimum size and liquidity requirements).
These are businesses that have both the desire and ability to pay shareholders rising dividends year-after-year. This is a rare combination.
Together, these two criteria are powerful – but they are not enough. Value must be considered as well.
The spreadsheet above allows you to sort by trailing price-to-earnings ratio so you can quickly find undervalued, high-quality dividend stocks.
Here’s how to use the Dividend Aristocrats list to quickly find high-quality dividend growth stocks potentially trading at a discount:
- Download the list
- Sort by ‘Trailing PE Ratio,’ smallest to largest
- Research the top stocks further
Here’s how to do this quickly in the spreadsheet:
Step 1: Download the list, and open it.
Step 2: Apply a filter function to each column in the spreadsheet.
Step 3: Click on the small gray down arrow next to ‘Trailing P/E Ratio’, and then sort smallest to largest.
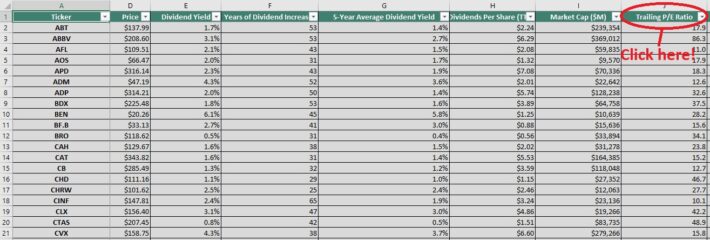
Step 4: Review the highest ranked Dividend Aristocrats before investing. You can see detailed analysis on every Dividend Aristocrat found below in this article.
That’s it; you can follow the same procedure to sort by any other metric in the spreadsheet.
Performance Of The Dividend Aristocrats
In March 2025, the Dividend Aristocrats, as measured by the Dividend Aristocrats ETF (NOBL), registered a negative total return of 1.3%. It out-performed the SPDR S&P 500 ETF (SPY) for the month.
- NOBL generated negative returns of -1.3% in March 2025
- SPY generated negative returns of -5.6% in March 2025
Short-term performance is mostly noise. Performance should be measured over a minimum of 3 years, and preferably longer periods of time.
The Dividend Aristocrats Index has slightly under-performed the broader market index over the last decade, with a 9.65% total annual return for the Dividend Aristocrats and a 12.42% total annual return for the S&P 500 Index.
But the Dividend Aristocrats have exhibited lower risk than the benchmark, as measured by standard deviation.
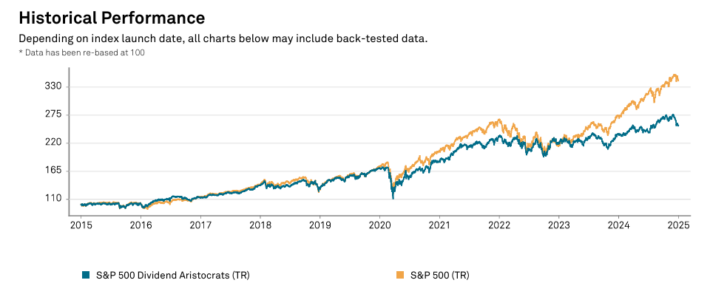
Source: S&P Fact Sheet
Higher total returns with lower volatility is the ‘holy grail’ of investing. It is worth exploring the characteristics of the Dividend Aristocrats in detail to determine why they have performed so well.
Note that a good portion of the outperformance relative to the S&P 500 comes during recessions (2000 – 2002, 2008). Dividend Aristocrats have historically seen smaller drawdowns during recessions versus the S&P 500. This makes holding through recessions that much easier.
Case-in-point: In 2008 the Dividend Aristocrats Index declined 22%. That same year, the S&P 500 declined 38%.
Great businesses with strong competitive advantages tend to be able to generate stronger cash flows during recessions. This allows them to gain market share while weaker businesses fight to stay alive.
The Dividend Aristocrats Index has beaten the market over the last 28 years…
We believe dividend paying stocks outperform non-dividend paying stocks for three reasons:
- A company that pays dividends is likely to be generating earnings or cash flows so that it can pay dividends to shareholders. This excludes ‘pre-earnings’ start-ups and failing businesses. In short, it excludes the riskiest stocks.
- A business that pays consistent dividends must be more selective with the growth projects it takes on because a portion of its cash flows are being paid out as dividends. Scrutinizing over capital allocation decisions likely adds to shareholder value.
- Stocks that pay dividends are willing to reward shareholders with cash payments. This is a sign that management is shareholder friendly.
In our view, Dividend Aristocrats have historically outperformed the market and other dividend paying stocks because they are, on average, higher-quality businesses.
A high-quality business should outperform a mediocre business over a long period of time, all other things being equal.
For a business to increase its dividends for 25+ consecutive years, it must have or at least had in the very recent past a strong competitive advantage.
Sector Overview
A sector breakdown of the Dividend Aristocrats Index is shown below:
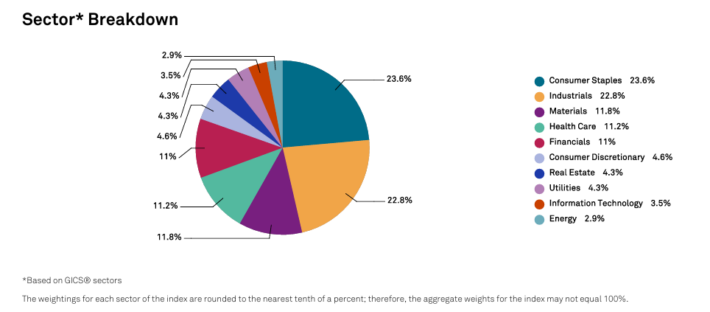
The Dividend Aristocrats Index is tilted toward Consumer Staples and Industrials relative to the S&P 500. These 2 sectors make up over 40% of the Dividend Aristocrats Index, but less than 20% of the S&P 500.
The Dividend Aristocrats Index is also significantly underweight the Information Technology sector, with a ~3% allocation compared with over 20% allocation within the S&P 500.
The Dividend Aristocrat Index is filled with stable ‘old economy’ blue chip consumer products businesses and manufacturers; the Coca-Cola’s (KO), and Johnson & Johnson’s (JNJ) of the investing world.
These ‘boring’ businesses aren’t likely to generate 20%+ earnings-per-share growth, but they also are very unlikely to see large earnings drawdowns as well.
The 10 Best Dividend Aristocrats Now
This research report examines the 10 best Dividend Aristocrats from our Sure Analysis Research Database with the highest 5-year forward expected total returns.
Dividend Aristocrat #10: S&P Global (SPGI)
- 5-year Expected Annual Returns: 12.4%
S&P Global is a worldwide provider of financial services and business information and revenue of over $13 billion.
Through its various segments, it provides credit ratings, benchmarks and indices, analytics, and other data to commodity market participants, capital markets, and automotive markets.
S&P Global has paid dividends continuously since 1937 and has increased its payout for 51 consecutive years.
S&P posted fourth quarter and full-year earnings on February 11th, 2025, and results were much better than expected on both the top and bottom lines.
Adjusted earnings-per-share came to $3.77, which was a staggering 30 cents ahead of estimates. Earnings rose from $3.13 a year ago.
Revenue was up 14% year-over-year to $3.59 billion, beating estimates by $90 million. The company posted revenue growth in all of its operating segments, in addition to strong operating margin expansion.
Operating expenses rose slightly from $2.26 billion to $2.33 billion year-over-year. That led to operating profit of $1.68 billion, sharply higher from $1.39 billion a year ago.
With dividend growth above 10%, SPGI is one of the rock solid dividend stocks.
Click here to download our most recent Sure Analysis report on SPGI (preview of page 1 of 3 shown below):

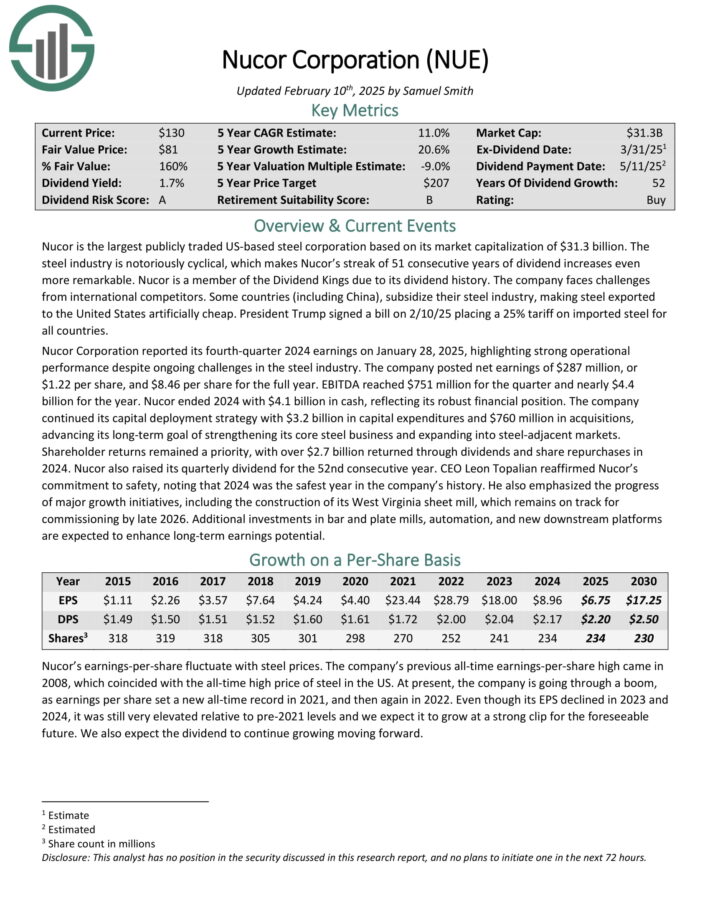
Dividend Aristocrat #9: Nucor Corp. (NUE)
- 5-year Expected Annual Returns: 12.7%
Nucor is the largest publicly traded US-based steel corporation based on its market capitalization. The steel industry is notoriously cyclical, which makes Nucor’s streak of 52 consecutive years of dividend increases even more remarkable.
Nucor Corporation reported its fourth-quarter 2024 earnings on January 28, 2025, highlighting strong operational performance despite ongoing challenges in the steel industry.
The company posted net earnings of $287 million, or $1.22 per share, and $8.46 per share for the full year. EBITDA reached $751 million for the quarter and nearly $4.4 billion for the year.
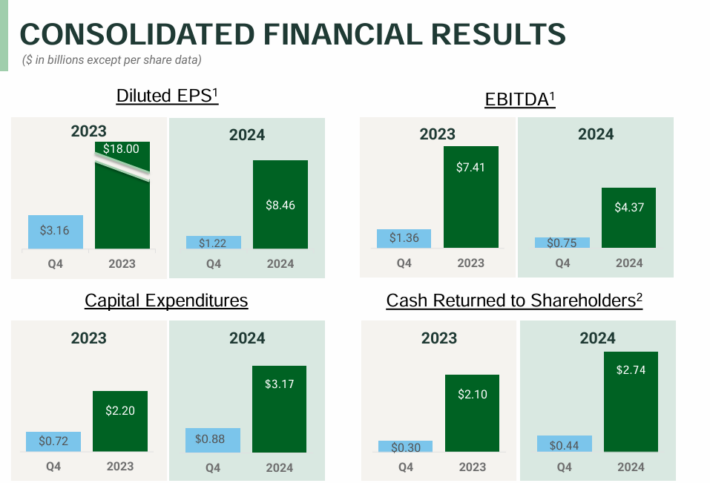
Source: Investor Presentation
Nucor ended 2024 with $4.1 billion in cash, reflecting its robust financial position.
As a commodity producer, Nucor is vulnerable to fluctuations in the price of steel. Steel demand is tied to construction and the overall economy.
Investors should be aware of the significant downside risk of Nucor as it is likely to perform poorly in a protracted recession.
That said, Nucor has raised its base dividend for 52 straight years. This indicates the strength of its business model and management team.
Click here to download our most recent Sure Analysis report on NUE (preview of page 1 of 3 shown below):
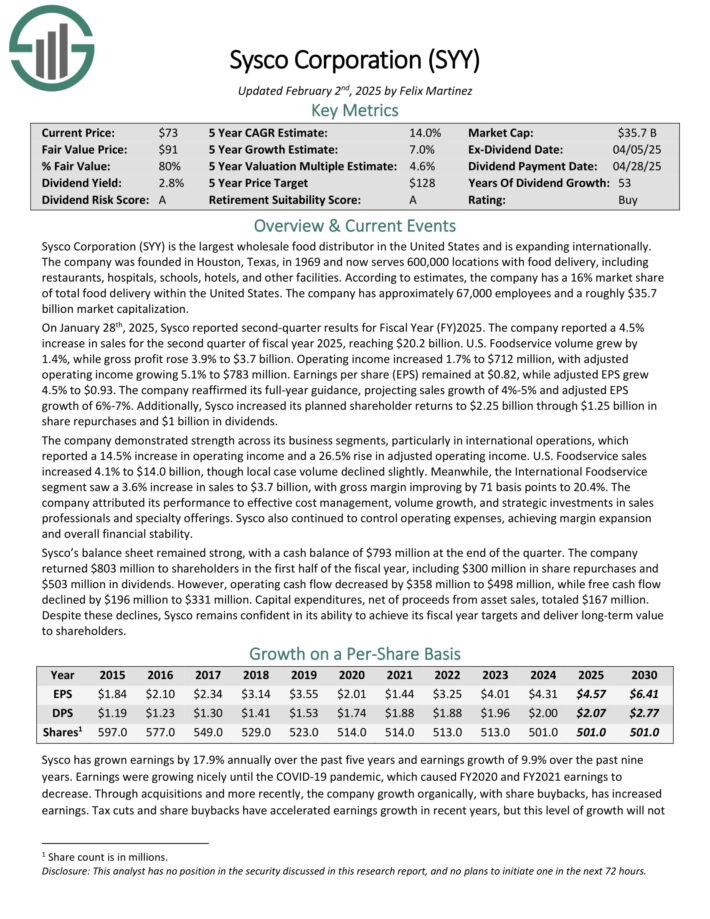
Dividend Aristocrat #8: Sysco Corporation (SYY)
- 5-year Expected Annual Returns: 13.3%
Sysco Corporation is the largest wholesale food distributor in the United States. The company serves 600,000 locations with food delivery, including restaurants, hospitals, schools, hotels, and other facilities.
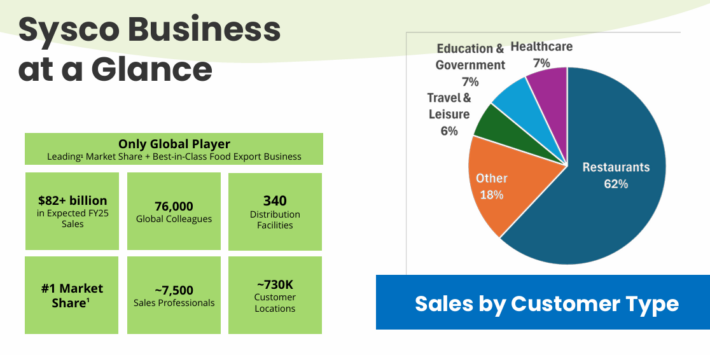
Source: Investor Presentation
On January 28th, 2025, Sysco reported second-quarter results for Fiscal Year (FY)2025. The company reported a 4.5% increase in sales for the second quarter of fiscal year 2025, reaching $20.2 billion.
U.S. Foodservice volume grew by 1.4%, while gross profit rose 3.9% to $3.7 billion. Operating income increased 1.7% to $712 million, with adjusted operating income growing 5.1% to $783 million. Earnings per share (EPS) remained at $0.82, while adjusted EPS grew 4.5% to $0.93.
The company reaffirmed its full-year guidance, projecting sales growth of 4%-5% and adjusted EPS growth of 6%-7%.
Click here to download our most recent Sure Analysis report on SYY (preview of page 1 of 3 shown below):
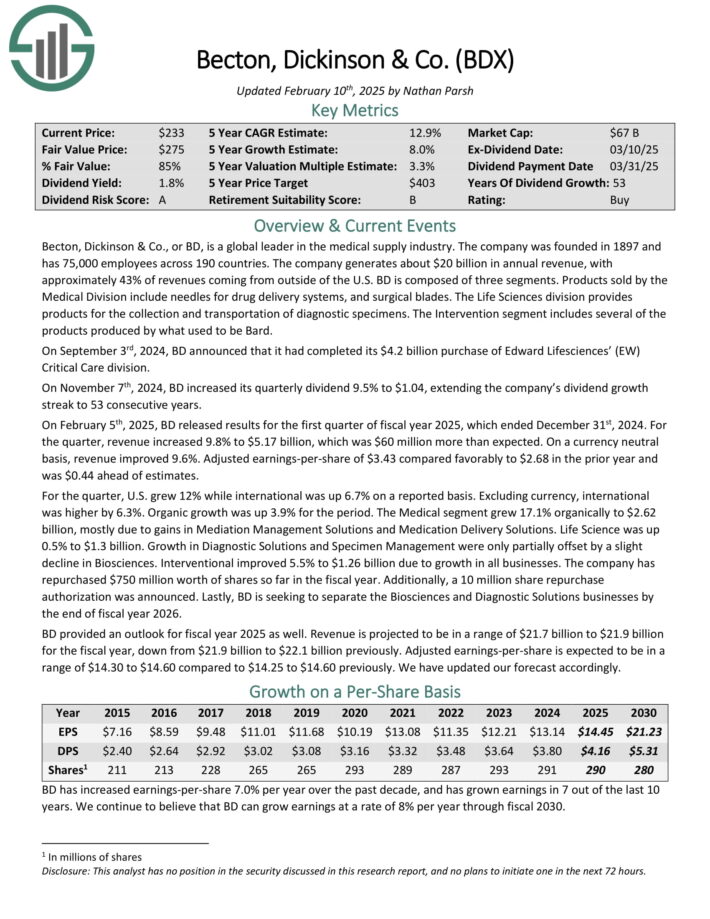
Dividend Aristocrat #7: Becton Dickinson & Co. (BDX)
- 5-year Expected Annual Returns: 13.3%
Becton, Dickinson & Co. is a global leader in the medical supply industry. The company was founded in 1897 and has 75,000 employees across 190 countries.
The company generates about $20 billion in annual revenue, with approximately 43% of revenues coming from outside of the U.S.
On February 5th, 2025, BD released results for the first quarter of fiscal year 2025, which ended December 31st, 2024. For the quarter, revenue increased 9.8% to $5.17 billion, which was $60 million more than expected.
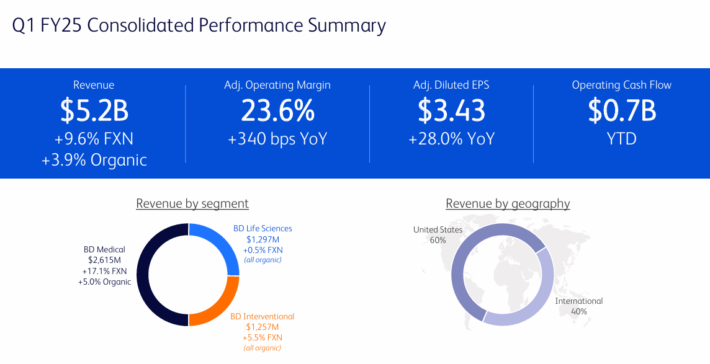
Source: Investor Presentation
On a currency neutral basis, revenue improved 9.6%. Adjusted earnings-per-share of $3.43 compared favorably to $2.68 in the prior year and was $0.44 ahead of estimates.
For the quarter, U.S. grew 12% while international was up 6.7% on a reported basis. Excluding currency, international was higher by 6.3%. Organic growth was up 3.9% for the period.
The Medical segment grew 17.1% organically to $2.62 billion, mostly due to gains in Mediation Management Solutions and Medication Delivery Solutions. Life Science was up 0.5% to $1.3 billion.
Click here to download our most recent Sure Analysis report on BDX (preview of page 1 of 3 shown below):
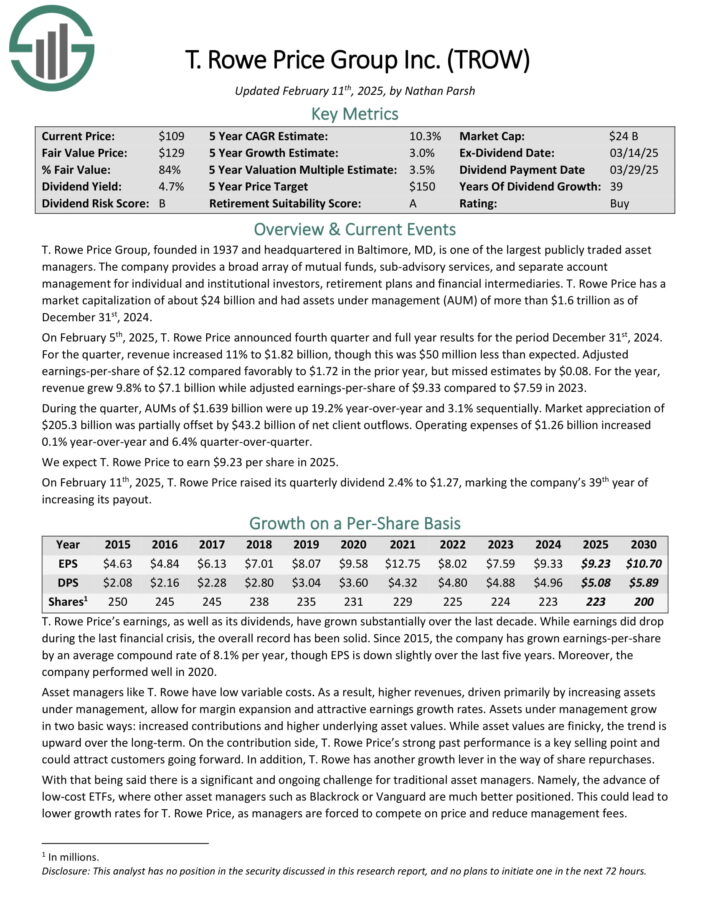
Dividend Aristocrat #6: T. Rowe Price Group (TROW)
- 5-year Expected Annual Returns: 14.1%
T. Rowe Price Group, founded in 1937 and headquartered in Baltimore, MD, is one of the largest publicly traded asset managers.
The company provides a broad array of mutual funds, sub-advisory services, and separate account management for individual and institutional investors, retirement plans and financial intermediaries.
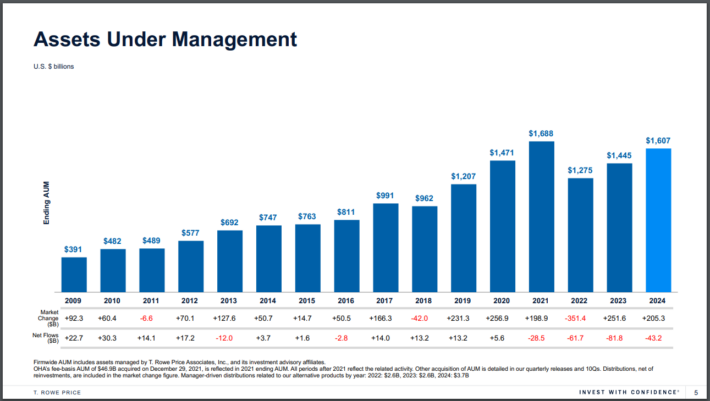
Source: Investor Presentation
Assets under management grow in two basic ways: increased contributions and higher underlying asset values. While asset values are finicky, the trend is upward over the long term.
In addition, T. Rowe has another growth lever in the form of share repurchases. The company has shrunk its share count by an annual rate of 1.3% over the last decade.
On February 5th, 2025, T. Rowe Price announced fourth quarter and full year results for the period December 31st, 2024.
For the quarter, revenue increased 11% to $1.82 billion, though this was $50 million less than expected. Adjusted earnings-per-share of $2.12 compared favorably to $1.72 in the prior year, but missed estimates by $0.08.
For the year, revenue grew 9.8% to $7.1 billion while adjusted earnings-per-share of $9.33 compared to $7.59 in 2023.
During the quarter, AUMs of $1.639 billion were up 19.2% year-over-year and 3.1% sequentially. Market appreciation of $205.3 billion was partially offset by $43.2 billion of net client outflows.
Operating expenses of $1.26 billion increased 0.1% year-over-year and 6.4% quarter-over-quarter.
Click here to download our most recent Sure Analysis report on TROW (preview of page 1 of 3 shown below):
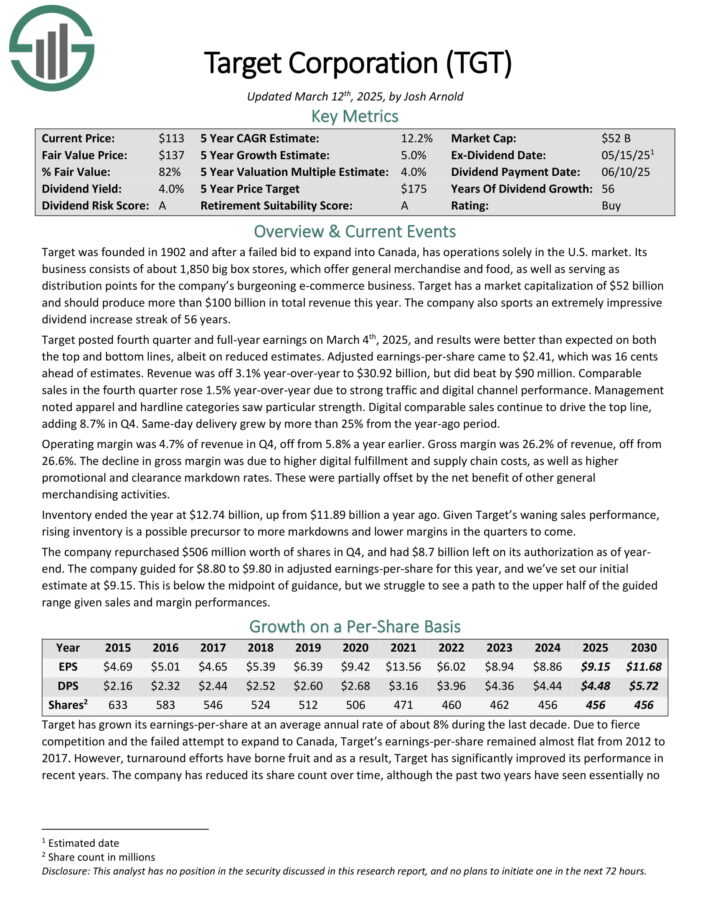
Dividend Aristocrat #5: Target Corporation (TGT)
- 5-year Expected Annual Returns: 14.1%
Target was founded in 1902 and now operates about 1,850 big box stores, which offer general merchandise and food, as well as serving as distribution points for the company’s e-commerce business.
Target posted fourth quarter and full-year earnings on March 4th, 2025, and results were better than expected on both the top and bottom lines, albeit on reduced estimates. Adjusted earnings-per-share came to $2.41, which was 16 cents ahead of estimates.
Revenue was off 3.1% year-over-year to $30.92 billion, but did beat estimates by $90 million. Comparable sales in the fourth quarter rose 1.5% year-over-year due to strong traffic and digital channel performance.
Management noted apparel and hardline categories saw particular strength.

Source: Investor Presentation
For 2025, Target expects around 1% sales growth and a modest increase in operating margins. However, factors like tariff uncertainties and shifting consumer confidence may pressure short-term profits.
The company remains focused on digital expansion, supply chain improvements, and shareholder returns, including dividend increases and stock buybacks, with $8.7 billion still available under its repurchase program.
Digital comparable sales continue to drive the top line, adding 8.7% in Q4. Same-day delivery grew by more than 25% from the year-ago period.
The company repurchased $506 million worth of shares in Q4, and had $8.7 billion left on its authorization as of year end. The company guided for $8.80 to $9.80 in adjusted earnings-per-share for this year.
Click here to download our most recent Sure Analysis report on TGT (preview of page 1 of 3 shown below):
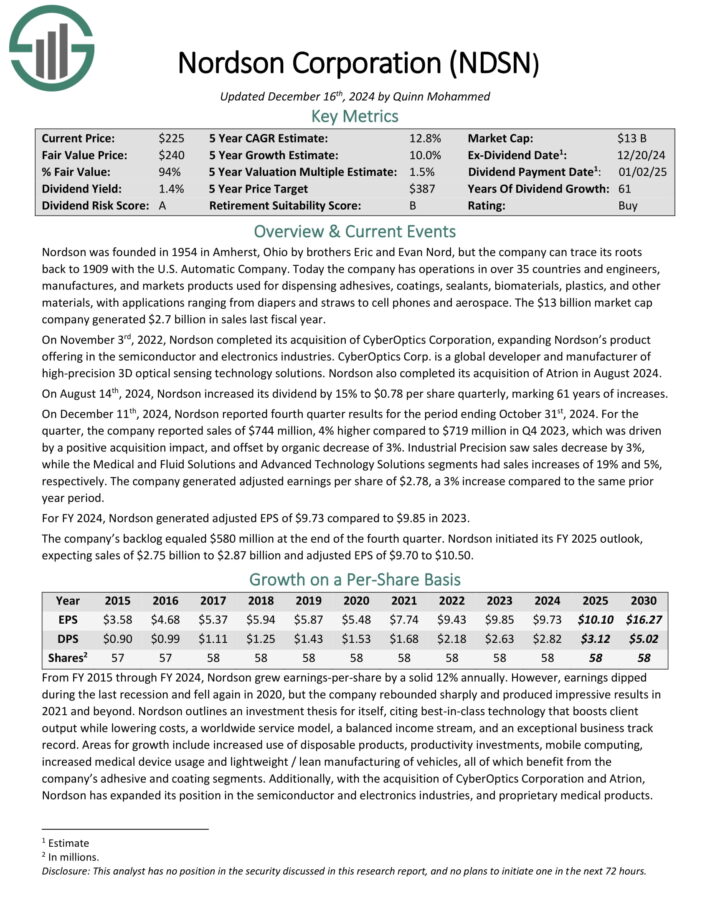
Dividend Aristocrat #4: Nordson Corporation (NDSN)
- 5-year Expected Annual Returns: 14.9%
Nordson was founded in 1954 in Amherst, Ohio by brothers Eric and Evan Nord, but the company can trace its roots back to 1909 with the U.S. Automatic Company.
Today the company has operations in over 35 countries and engineers, manufactures, and markets products used for dispensing adhesives, coatings, sealants, biomaterials, plastics, and other materials, with applications ranging from diapers and straws to cell phones and aerospace.
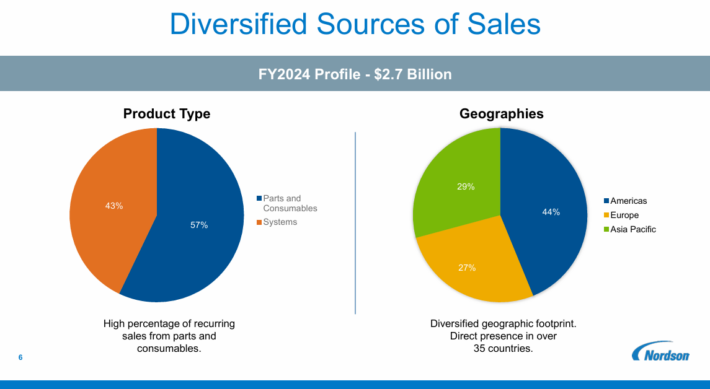
Source: Investor Presentation
On December 11th, 2024, Nordson reported fourth quarter results for the period ending October 31st, 2024. For the quarter, the company reported sales of $744 million, 4% higher compared to $719 million in Q4 2023, which was driven by a positive acquisition impact, and offset by organic decrease of 3%.
Industrial Precision saw sales decrease by 3%, while the Medical and Fluid Solutions and Advanced Technology Solutions segments had sales increases of 19% and 5%, respectively.
The company generated adjusted earnings per share of $2.78, a 3% increase compared to the same prior year period.
Click here to download our most recent Sure Analysis report on NDSN (preview of page 1 of 3 shown below):
Dividend Aristocrat #3: PepsiCo Inc. (PEP)
- 5-year Expected Annual Returns: 15.6%
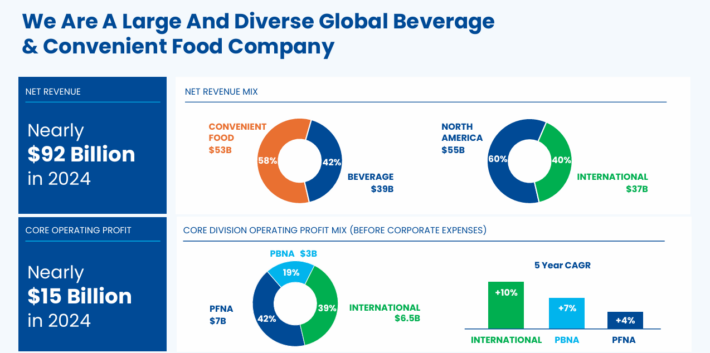
PepsiCo is a global food and beverage company. Its products include Pepsi, Mountain Dew, Frito-Lay chips, Gatorade, Tropicana orange juice and Quaker foods.
Its business is split roughly 60-40 in terms of food and beverage revenue. It is also balanced geographically between the U.S. and the rest of the world.
Source: Investor Presentation
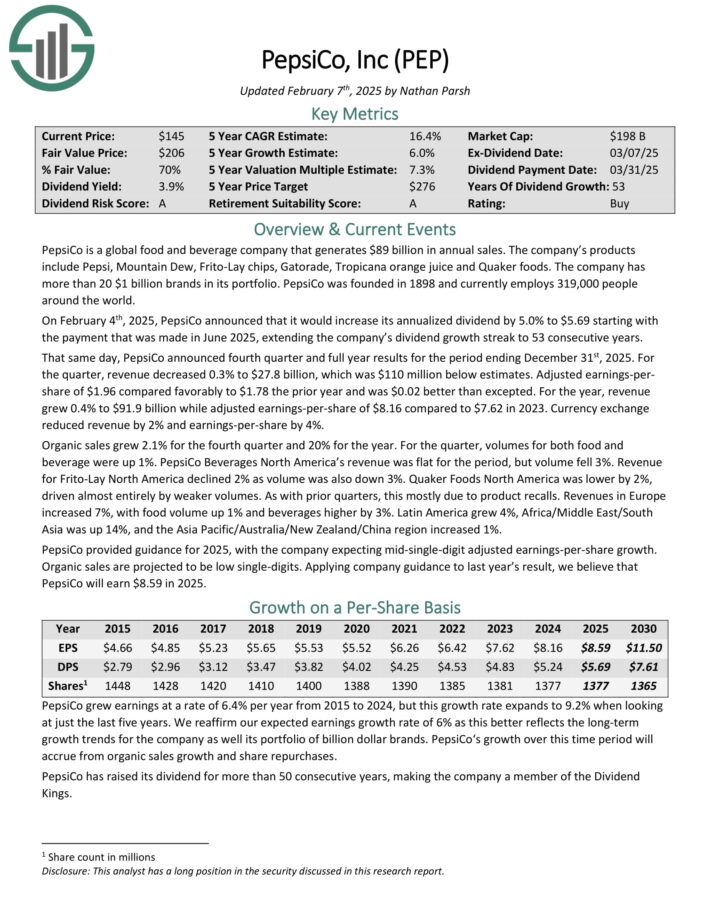
On February 4th, 2025, PepsiCo announced that it would increase its annualized dividend by 5.0% to $5.69 starting with the payment that was made in June 2025, extending the company’s dividend growth streak to 53 consecutive years.
That same day, PepsiCo announced fourth quarter and full year results for the period ending December 31st, 2025. For the quarter, revenue decreased 0.3% to $27.8 billion, which was $110 million below estimates.
Adjusted earnings-per-share of $1.96 compared favorably to $1.78 the prior year and was $0.02 better than excepted.
For the year, revenue grew 0.4% to $91.9 billion while adjusted earnings-per-share of $8.16 compared to $7.62 in 2023. Currency exchange reduced revenue by 2% and earnings-per-share by 4%.
Click here to download our most recent Sure Analysis report on PEP (preview of page 1 of 3 shown below):
Dividend Aristocrat #2: PPG Industries (PPG)
- 5-year Expected Annual Returns: 15.7%
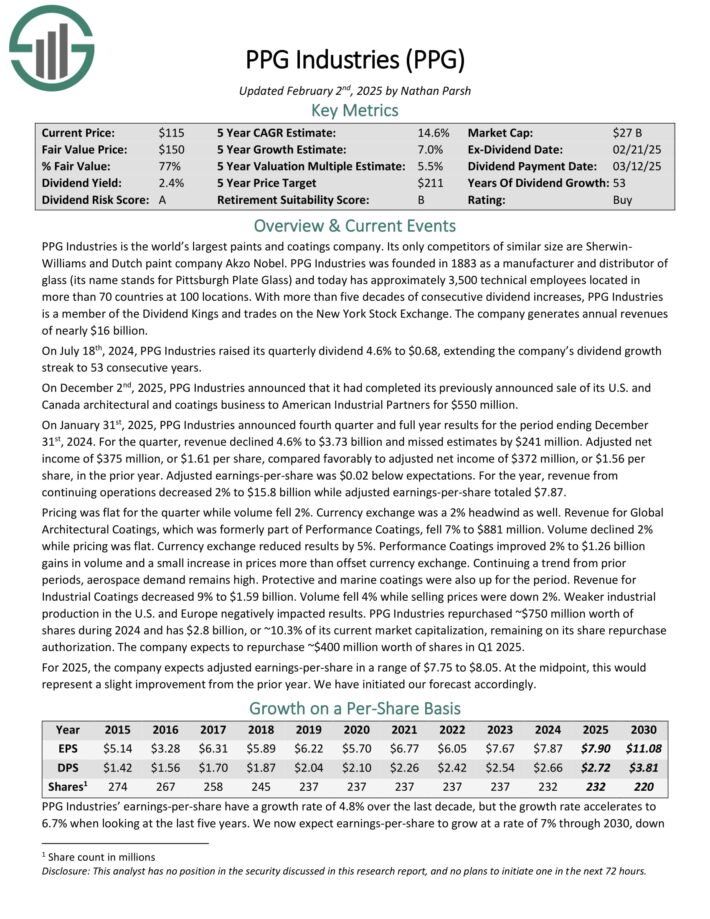
PPG Industries is the world’s largest paints and coatings company. Its only competitors of similar size are Sherwin-Williams and Dutch paint company Akzo Nobel.
PPG Industries was founded in 1883 as a manufacturer and distributor of glass (its name stands for Pittsburgh Plate Glass) and today has approximately 3,500 technical employees located in more than 70 countries at 100 locations.
On January 31st, 2025, PPG Industries announced fourth quarter and full year results for the period ending December 31st, 2024. For the quarter, revenue declined 4.6% to $3.73 billion and missed estimates by $241 million.
Adjusted net income of $375 million, or $1.61 per share, compared favorably to adjusted net income of $372 million, or $1.56 per share, in the prior year. Adjusted earnings-per-share was $0.02 below expectations.
For the year, revenue from continuing operations decreased 2% to $15.8 billion while adjusted earnings-per-share totaled $7.87.
PPG Industries repurchased ~$750 million worth of shares during 2024 and has $2.8 billion, or ~10.3% of its current market capitalization, remaining on its share repurchase authorization. The company expects to repurchase ~$400 million worth of shares in Q1 2025.
For 2025, the company expects adjusted earnings-per-share in a range of $7.75 to $8.05.
Click here to download our most recent Sure Analysis report on PPG (preview of page 1 of 3 shown below):
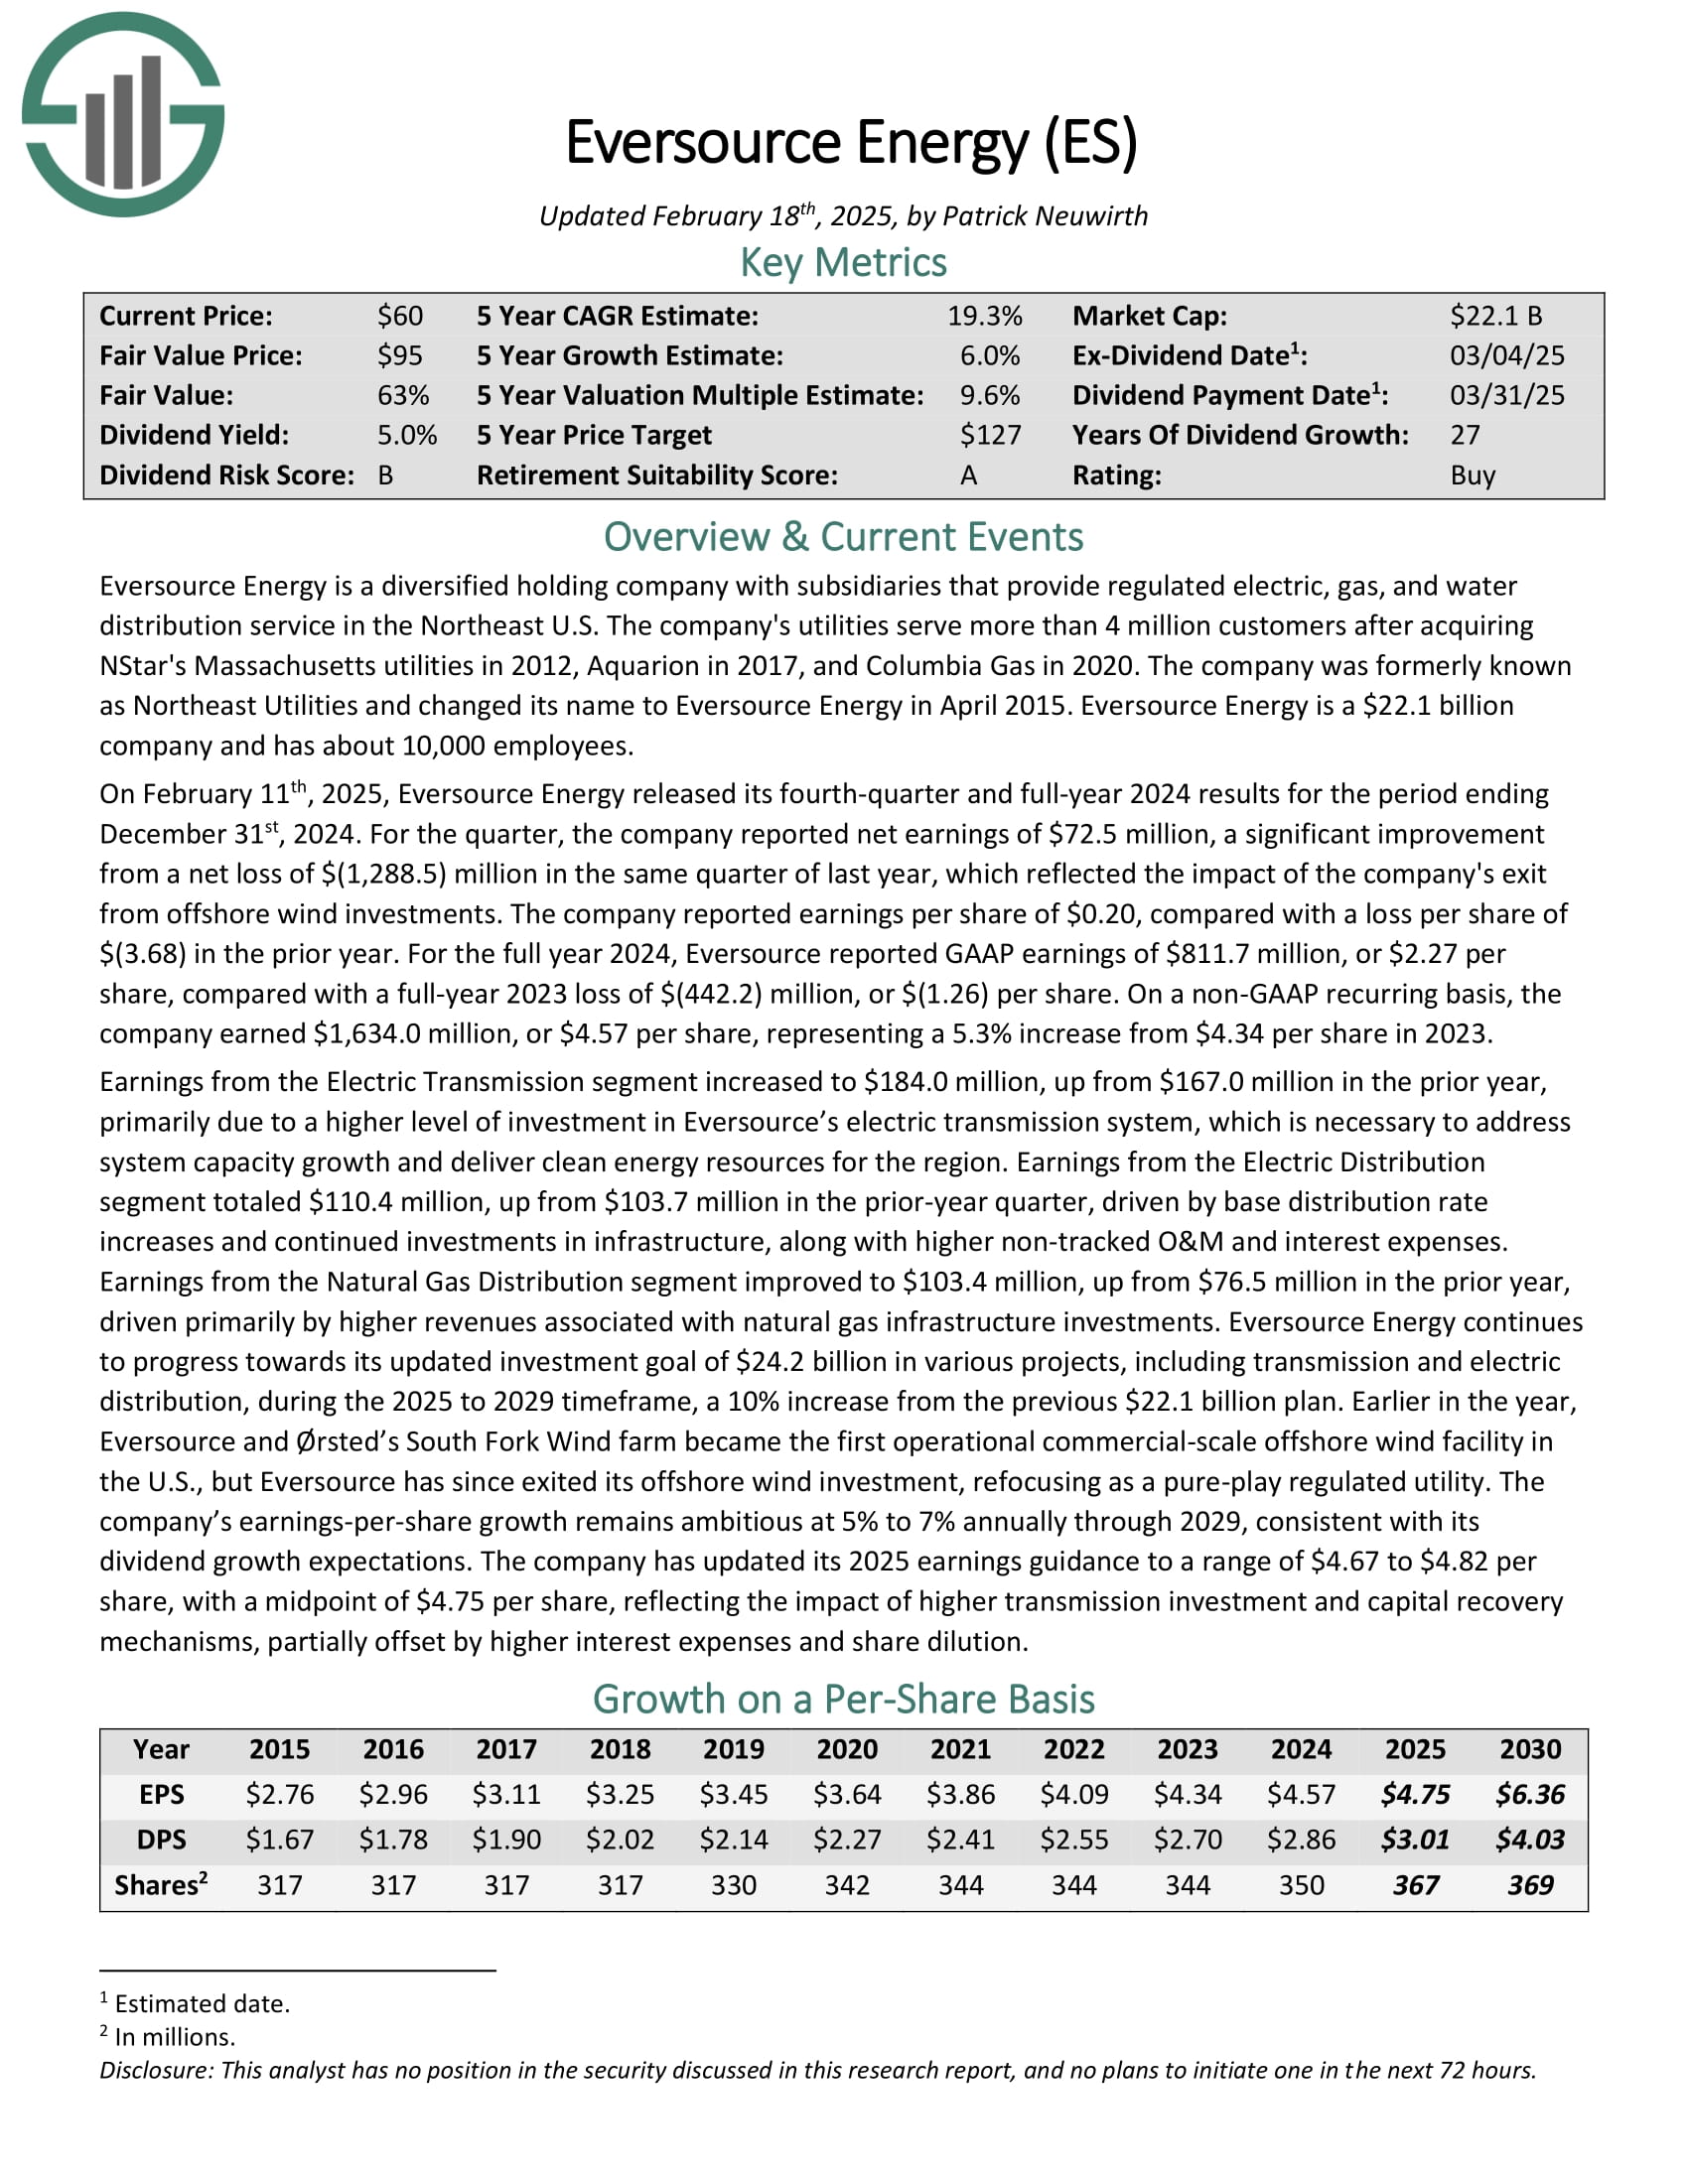
Dividend Aristocrat #1: Eversource Energy (ES)
- 5-year Expected Annual Returns: 18.5%
Eversource Energy is a diversified holding company with subsidiaries that provide regulated electric, gas, and water distribution service in the Northeast U.S.
FactSet, Erie Indemnity, and Eversource Energy are the three new Dividend Aristocrats for 2025.
The company’s utilities serve more than 4 million customers after acquiring NStar’s Massachusetts utilities in 2012, Aquarion in 2017, and Columbia Gas in 2020.
Eversource has delivered steady growth to shareholders for many years.
Source: Investor Presentation
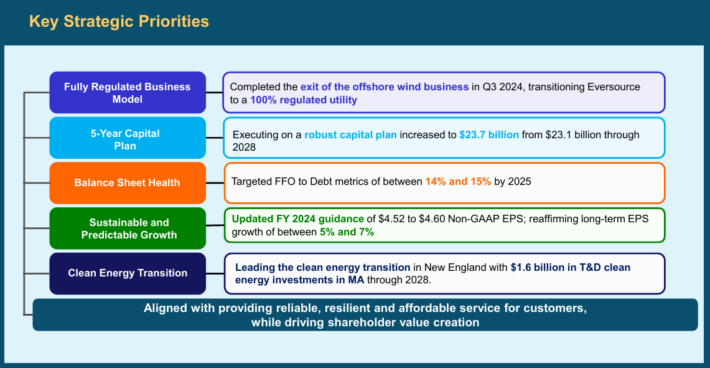
On February 11th, 2025, Eversource Energy released its fourth-quarter and full-year 2024 results. For the quarter, the company reported net earnings of $72.5 million, a significant improvement from a net loss of $(1,288.5) million in the same quarter of last year, which reflected the impact of the company’s exit from offshore wind investments.
The company reported earnings per share of $0.20, compared with a loss per share of $(3.68) in the prior year. For the full year 2024, Eversource reported GAAP earnings of $811.7 million, or $2.27 per share, compared with a full-year 2023 loss of $(442.2) million, or $(1.26) per share.
On a non-GAAP recurring basis, the company earned $1,634.0 million, or $4.57 per share, representing a 5.3% increase from 2023.
Click here to download our most recent Sure Analysis report on ES (preview of page 1 of 3 shown below):
The Dividend Aristocrats In Focus Analysis Series
You can see analysis on every single Dividend Aristocrat below. Each is sorted by GICS sectors and listed in alphabetical order by name. The newest Sure Analysis Research Database report for each security is included as well.
Consumer Staples
- Archer-Daniels-Midland (ADM) | [See newest Sure Analysis report]
- Amcor (AMCR) | [See newest Sure Analysis report]
- Brown-Forman (BF-B) | [See newest Sure Analysis report]
- Colgate-Palmolive (CL) | [See newest Sure Analysis report]
- Church & Dwight (CHD) | [See newest Sure Analysis report]
- Clorox (CLX) | [See newest Sure Analysis report]
- Coca-Cola (KO) | [See newest Sure Analysis report]
- Hormel Foods (HRL) | [See newest Sure Analysis report]
- J.M. Smucker (SJM) | [See newest Sure Analysis report]
- Kimberly-Clark (KMB) | [See newest Sure Analysis report]
- McCormick & Company (MKC) | [See newest Sure Analysis report]
- PepsiCo (PEP) | [See newest Sure Analysis report]
- Procter & Gamble (PG) [See newest Sure Analysis report]
- Sysco Corporation (SYY) [See newest Sure Analysis report]
- Walmart (WMT) | [See newest Sure Analysis report]
Industrials
- Automatic Data Processing (ADP) | [See newest Sure Analysis report]
- A.O. Smith (AOS) | [See newest Sure Analysis report]
- C.H. Robinson Worldwide (CHRW) | [See newest Sure Analysis report]
- Cintas (CTAS) | [See newest Sure Analysis report]
- Dover (DOV) | [See newest Sure Analysis report]
- Emerson Electric (EMR) | [See newest Sure Analysis report]
- Expeditors International (EXPD) | [See newest Sure Analysis report]
- Fastenal Co. (FAST) | [See newest Sure Analysis report]
- Illinois Tool Works (ITW) | [See newest Sure Analysis report]
- Nordson Corporation (NDSN) | [See newest Sure Analysis report]
- Pentair (PNR) | [See newest Sure Analysis report]
- Roper Technologies (ROP) | [See newest Sure Analysis report]
- Stanley Black & Decker (SWK) | [See newest Sure Analysis report]
- W.W. Grainger (GWW) | [See newest Sure Analysis report]
- General Dynamics (GD) | [See newest Sure Analysis report]
- Caterpillar (CAT) | [See newest Sure Analysis report]
Health Care
- Abbott Laboratories (ABT) | [See newest Sure Analysis report]
- AbbVie (ABBV) | [See newest Sure Analysis report]
- Becton, Dickinson & Company (BDX) | [See newest Sure Analysis report]
- Cardinal Health (CAH) | [See newest Sure Analysis report]
- Johnson & Johnson (JNJ) | [See newest Sure Analysis report]
- Kenvue Inc. (KVUE) | [See newest Sure Analysis report]
- Medtronic (MDT) | [See newest Sure Analysis report]
- West Pharmaceutical Services (WST) | [See newest Sure Analysis report]
Consumer Discretionary
- Genuine Parts Company (GPC) | [See newest Sure Analysis report]
- Lowe’s Companies (LOW) | [See newest Sure Analysis report]
- McDonald’s (MCD) | [See newest Sure Analysis report]
- Target (TGT) | [See newest Sure Analysis report]
Financials
- Aflac (AFL) | [See newest Sure Analysis report]
- Brown & Brown (BRO) | [See newest Sure Analysis report]
- Cincinnati Financial (CINF) | [See newest Sure Analysis report]
- Erie Indemnity (ERIE) | [See newest Sure Analysis report]
- FactSet Research Systems (FDS) | [See newest Sure Analysis report]
- Franklin Resources (BEN) | [See newest Sure Analysis report]
- S&P Global (SPGI) | [See newest Sure Analysis report]
- T. Rowe Price Group (TROW) | [See newest Sure Analysis report]
- Chubb (CB) | [See newest Sure Analysis report]
Materials
- Air Products and Chemicals (APD) | [See newest Sure Analysis report]
- Albemarle (ALB) | [See newest Sure Analysis report]
- Ecolab (ECL) | [See newest Sure Analysis report]
- PPG Industries (PPG) | [See newest Sure Analysis report]
- Sherwin-Williams (SHW) | [See newest Sure Analysis report]
- Nucor (NUE) | [See newest Sure Analysis report]
- Linde (LIN) | [See newest Sure Analysis report]
Energy
- Chevron (CVX) | [See newest Sure Analysis report]
- Exxon Mobil (XOM) | [See newest Sure Analysis report]
- Eversource Energy (ES) | [See newest Sure Analysis report]
Information Technology
Real Estate
- Essex Property Trust (ESS) | [See newest Sure Analysis report]
- Federal Realty Investment Trust (FRT) | [See newest Sure Analysis report]
- Realty Income (O) | [See newest Sure Analysis report]
Utilities
- Atmos Energy (ATO) | [See newest Sure Analysis report]
- Consolidated Edison (ED) | [See newest Sure Analysis report]
- NextEra Energy (NEE) | [See newest Sure Analysis report]
Historical Dividend Aristocrats List
(1989 – 2025)
The image below shows the history of the Dividend Aristocrats Index from 1989 through 2025:
Note: CL, GPC, and NUE were all removed and re-added to the Dividend Aristocrats Index through the historical period analyzed above. We are unsure as to why. Companies created via a spin-off (like AbbVie) can be Dividend Aristocrats with less than 25 years of rising dividends if the parent company was a Dividend Aristocrat.
Disclaimer: Sure Dividend is not affiliated with S&P Global in any way. S&P Global owns and maintains The Dividend Aristocrats Index. The information in this article and downloadable spreadsheet and image below is based on Sure Dividend’s own review, summary, and analysis of the S&P 500 Dividend Aristocrats ETF (NOBL) and other sources, and is meant to help individual investors better understand this ETF and the index upon which it is based. None of the information in this article or spreadsheet is official data from S&P Global. Consult S&P Global for official information.

This information was compiled from the following sources:
- 1989 – 1991: Dividend Growth Investor
- 1992 – 2015: NOBL Index Historical Constituents
- 2016: Sure Dividend update
- 2017 – 2025: Data from S&P press releases and tracking dividends
Frequently Asked Questions
This section will address some of most common questions investors have regarding the Dividend Aristocrats.
1. What is the highest-paying Dividend Aristocrat?
Answer: Franklin Resources (BEN) currently yields 6.5%.
2. What is the difference between the Dividend Aristocrats and the Dividend Kings?
Answer: The Dividend Aristocrats must be constituents of the S&P 500 Index, have raised their dividends for at least 25 consecutive years, and satisfy a number of liquidity requirements.
The Dividend Kings only need to have raised their dividends for at least 50 consecutive years.
3. Is there an ETF that tracks the Dividend Aristocrats?
Answer: Yes, the Dividend Aristocrats ETF (NOBL) is an exchange-traded fund that specifically holds the Dividend Aristocrats.
4. What is the difference between the Dividend Aristocrats and the Dividend Champions?
Answer: The Dividend Aristocrats and Dividend Champions share one requirement, which is that a company must have raised its dividend for at least 25 consecutive years.
But like the Dividend Kings, the Dividend Champions do not need to be in the S&P 500 Index, nor satisfy the various liquidity requirements.
5. Which Dividend Aristocrat has the longest active streak of annual dividend increases?
Currently, there are 3 Dividend Aristocrats tied at 69 years: Procter & Gamble, Genuine Parts, and Dover Corporation.
6. What is the average dividend yield of the Dividend Aristocrats?
Right now, the average dividend yield of the Dividend Aristocrats is 2.0%.
7. Are the Dividend Aristocrats safe investments?
While there are never any guarantees when it comes to the stock market, we believe the Dividend Aristocrats are among the safest dividend stocks when it comes to the sustainability of their dividend payouts.
The Dividend Aristocrats have durable competitive advantages that allow them to raise their dividends each year, even during a recession.
Other Dividend Lists & Final Thoughts
The Dividend Aristocrats list is not the only way to quickly screen for stocks that regularly pay rising dividends.
- The Dividend Kings List is even more exclusive than the Dividend Aristocrats. It is comprised of 55 stocks with 50+ years of consecutive dividend increases.
- The Blue Chip Stocks List: stocks that qualify as Dividend Achievers, Dividend Aristocrats, and/or Dividend Kings
- The High Dividend Stocks List: stocks that appeal to investors interested in the highest yields of 5% or more.
- The Monthly Dividend Stocks List: stocks that pay dividends every month, for 12 dividend payments per year.
There is nothing magical about the Dividend Aristocrats. They are ‘just’ a collection of high-quality shareholder friendly stocks that have strong competitive advantages.
Purchasing these types of stocks at fair or better prices and holding for the long-run will likely result in favorable long-term performance.